. 2005 Sep;26(1):15-29.
doi: 10.1002/hbm.20113.

Spontaneous low-frequency BOLD signal fluctuations: an fMRI investigation of the resting-state default mode of brain function hypothesis

Affiliations

Spontaneous low-frequency BOLD signal fluctuations: an fMRI investigation of the resting-state default mode of brain function hypothesis

Peter Fransson. Hum Brain Mapp. 2005 Sep.

Abstract

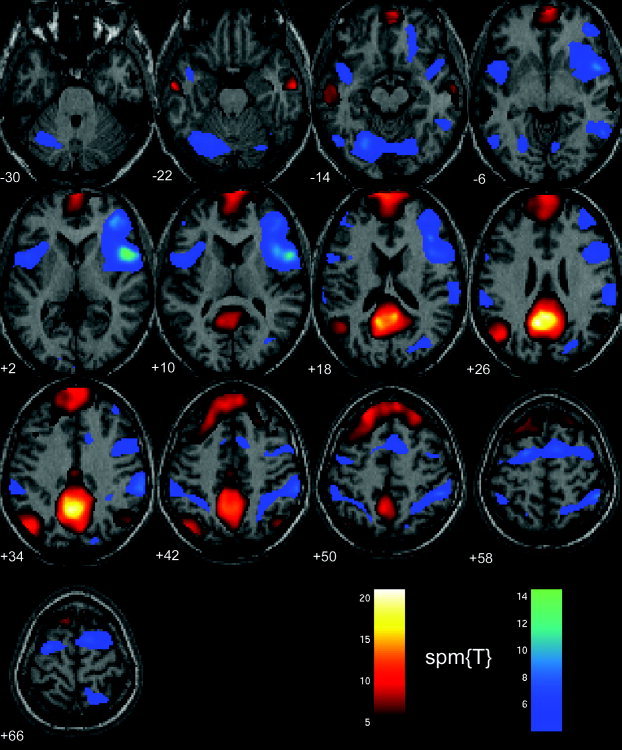
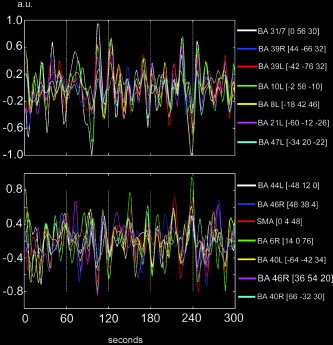
Recent neuroimaging studies have lead to the proposal that rest is characterized by an organized, baseline level of activity, a default mode of brain function that is suspended during specific goal-oriented mental activity. Previous studies have shown that the primary function subserved by the default mode is that of an introspectively oriented, self-referential mode of mental activity. The default mode of brain function hypothesis is readdressed from the perspective of the presence of low-frequency blood oxygenation level-dependent (BOLD) functional magnetic resonance imaging (fMRI) signal changes (0.012-0.1 Hz) in the resting brain. The results show that the brain during rest is not tonically active in a single mode of brain function. Rather, the findings presented here suggest that the brain recurrently toggles between an introspectively oriented mode (default mode) and a state-of-mind that tentatively might be interpreted as an extrospectively oriented mode that involves a readiness and alertness to changes in the external and internal environment.


Figures

Figure 1
Figure 1
Spontaneous low‐frequency BOLD signal fluctuations during rest (eyes closed) in individual subjects. Images of F‐contrast statistical parametrical maps thresholded at F > 1.69 (P < 0.001, uncorrected) showing low‐frequency BOLD signal fluctuations in three representative subjects (left, middle, and right column, respectively). Spontaneous BOLD signal changes during rest are present in widespread areas in the brain that are localized predominately to gray matter. Of note is the particular strong presence in the MPFC, precuneus and the PCC in all three subjects.
Figure 2
Figure 2
Multi‐subject analysis of BOLD signal fluctuations during rest with eyes closed. A binary mask for each subject was created by thresholding the individual F‐contrast images at F > 1.69 (P < 0.001 uncorrected). A final binary mask image showing voxels in the brain exhibiting low‐frequency fluctuations in all subjects at the specified statistical threshold was constructed by multiplying together all the individual binary mask images. Voxels that met these criteria are depicted in red and superimposed on a T1‐weighted high‐resolution MR image of one subject in the study. Spontaneous, low frequency BOLD signal changes at a multi‐subject level are observed in the prefrontal cortex with clusters centered foremost in the medial PFC and bilaterally in the dorsolateral cortices. Extensive areas of activity are present in the parietal cortex bilaterally and the precuneus and PCC.
Figure 3
Figure 3
Multi‐subject analysis of BOLD signal fluctuations during rest (eyes closed). Maximum intensity projection (MIP) images showing voxels that exhibited low‐frequency fluctuations in all subjects at the statistical threshold of F > 2.64 (P < 0.5 × 10⁻³, corrected). Low‐frequency BOLD fluctuations are observed in the MPFC, precuneus/PCC, and the left angular gyrus.
Figure 4
Figure 4
Functional connectivity analysis of low‐frequency BOLD signal changes during rest with eyes closed. The figure shows two statistical parametrical maps SPM[T] thresholded at P < 0.01, (corrected for multiple comparisons) superimposed on a single high‐resolution T1‐weighted image from one subject in the study. Areas color‐coded in a red‐yellow color scale correlate positively with the precuneus/PCC region and included medial and dorsolateral parts of prefrontal cortex, angular gyrus, anterolateral section of the temporal lobe, parahippocampal gyrus, thalamus, and pons. Brain regions that correlate negatively with the precuneus/PCC region are color‐coded in blue‐magenta color scale and included premotor cortex bilaterally, dorsolateral prefrontal cortex, supplementary motor cortex, inferior parietal lobe, occipital cortex, and the insula bilaterally.
Figure 5
Figure 5
Functional connectivity during rest (eyes open). Brain regions that in the eyes‐open condition correlated positively (red‐yellow color‐coded) and negatively (blue‐magenta color‐coded) with the precuneus/PCC area are matched very closely to the corresponding brain regions involved for the eyes‐closed condition (see Fig. 4 for comparison). Minor differences between the two conditions exist. For example, the positive correlation in the parahippocampal gyrus and the inferior frontal cortex was only found in the left hemisphere in the eyes‐open condition. Moreover, a negative correlation with the precuneus was found in the lateral cerebellum for the eyes‐open condition but not in the eyes‐closed condition.
Figure 6
Figure 6
BOLD signal intensity time‐courses during rest (eyes closed) for a selected set of region‐of‐interests in one representative subject. Each signal intensity time course represents the mean time course from all voxels inside a spherical (radius = 10 mm) ROI positioned in proximity to the local maxima of activated clusters given by the connectivity analysis shown in Figure 4. Top: Signal intensity time course for a selected set of regions that correlated positively with the precuneus/PCC. Bottom: Temporal profile for a set of regions that correlated negatively with the precuneus/PCC. All signal intensity time courses were bandpass filtered.

References

    1. Aguirre GK, Zarahn E, D'Esposito M (1998): The inferential impact of global signal covariates in functional neuroimaging analyses. Neuroimage 8: 302–306. - PubMed
    1. Andersen RA, Buneo CA (2003): Sensorimotor integration in posterior parietal cortex. Adv Neurology 93: 159–177. - PubMed
    1. Andersson JL, Hutton C, Ashburner J, Turner R, Friston K (2001): Modeling geometric deformations in EPI time series. Neuroimage 13: 903–915. - PubMed
    1. Andreasen NC, O'Leary DS, Cizadlo T, Arndt S, Rezai K, Watkins GL, Ponto LL, Hichwa RD (1995): Remembering the past: two facets of episodic memory explored with position emission tomography. Am J Psychiatry 152: 1576–1585. - PubMed
    1. Baker SC, Rogers RD, Owen AD, Frith CD, Dolan RJ, Frackowiak RSJ, Robbins TW (1996): Neural systems engaged by planning: a PET study of the Tower of London task. Neuropsychologia 6: 515–526. - PubMed

LinkOut - more resources