

Drawing on mind's canvas: differences in cortical integration patterns between artists and non-artists
- PMID: 15852480
- PMCID: PMC6871726
- DOI: 10.1002/hbm.20104
Drawing on mind's canvas: differences in cortical integration patterns between artists and non-artists
Abstract
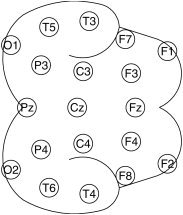
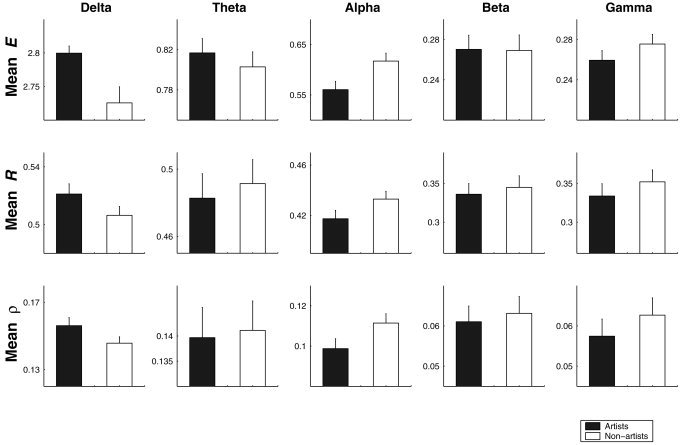
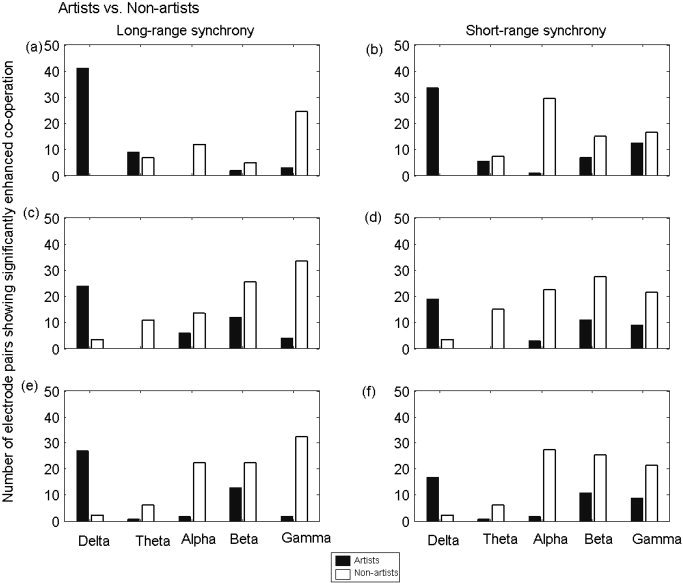
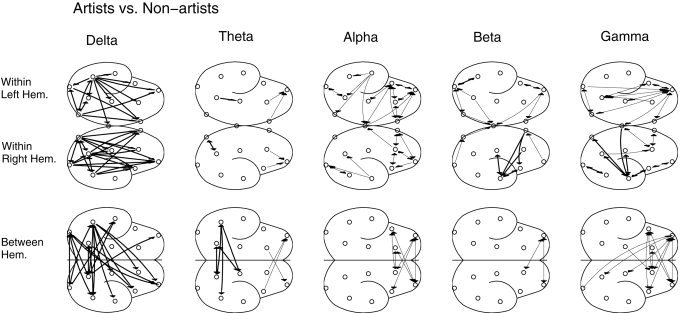
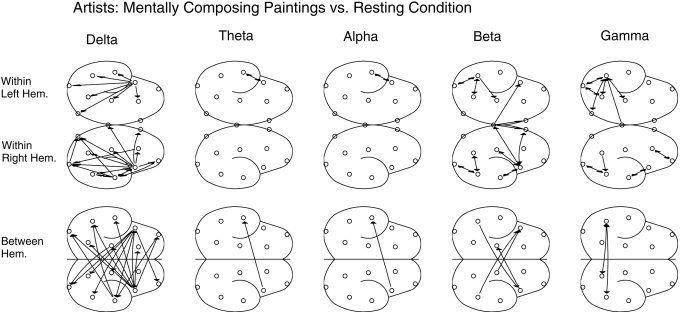
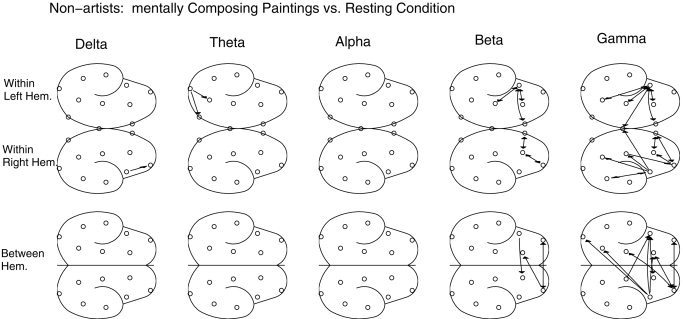
Our primary question was to learn whether mentally composing drawings of their own choice produce different brain electric features in artists and laymen. To this purpose, we studied multichannel electroencephalograph (EEG) signals from two broad groups (all participants were females): artists (professionally trained in visual arts) and non-artists (without any training in art). To assess the underlying synchronization, which is assumed to be the platform for general cognitive integration between different cortical regions, three measures inspired by nonlinear dynamical system theory were applied as follows: (1) index based on generalized synchronization; (2) index based on mean phase coherence; and (3) index of phase synchrony based on entropy. Results consistent over all three measures were as follows: comparing the tasks to rest, the artists showed significantly stronger short- and long-range delta band synchronization, whereas the non-artists showed enhancement in short-range beta and gamma band synchronization primarily in frontal regions; comparing the two groups during the tasks, the artists showed significantly stronger delta band synchronization and alpha band desynchronization than did the non-artists. Strong right hemispheric dominance in terms of synchronization was found in the artists. In artists, the higher synchrony in the low-frequency band is possibly due to the involvement of a more advanced long-term visual art memory and to extensive top-down processing. The results demonstrate that in artists, patterns of functional cooperation between cortical regions during mental creation of drawings were significantly different from those in non-artists.
Figures
Similar articles
-
Shadows of artistry: cortical synchrony during perception and imagery of visual art.Brain Res Cogn Brain Res. 2002 Apr;13(2):179-86. doi: 10.1016/s0926-6410(01)00110-0. Brain Res Cogn Brain Res. 2002. PMID: 11958960 Clinical Trial.
-
EEG gamma-band phase synchronization between posterior and frontal cortex during mental rotation in humans.Neurosci Lett. 2001 Sep 21;311(1):29-32. doi: 10.1016/s0304-3940(01)02133-4. Neurosci Lett. 2001. PMID: 11585560
-
From local inhibition to long-range integration: a functional dissociation of alpha-band synchronization across cortical scales in visuospatial attention.Brain Res. 2009 Dec 15;1303:97-110. doi: 10.1016/j.brainres.2009.09.069. Epub 2009 Sep 24. Brain Res. 2009. PMID: 19782056
-
Memory processes, brain oscillations and EEG synchronization.Int J Psychophysiol. 1996 Nov;24(1-2):61-100. doi: 10.1016/s0167-8760(96)00057-8. Int J Psychophysiol. 1996. PMID: 8978436 Review.
-
[Psychophysiologic and clinical aspects of EEG synchronization related to cognitive processes].Ideggyogy Sz. 2005 Nov 20;58(11-12):393-401. Ideggyogy Sz. 2005. PMID: 16491564 Review. Hungarian.
Cited by
-
Art expertise modulates the emotional response to modern art, especially abstract: an ERP investigation.Front Hum Neurosci. 2015 Sep 30;9:525. doi: 10.3389/fnhum.2015.00525. eCollection 2015. Front Hum Neurosci. 2015. PMID: 27242497 Free PMC article.
-
Evidence for a left-over-right inhibitory mechanism during figural creative thinking in healthy nonartists.Hum Brain Mapp. 2013 Oct;34(10):2724-32. doi: 10.1002/hbm.22093. Epub 2012 Apr 21. Hum Brain Mapp. 2013. PMID: 22522783 Free PMC article.
-
Shared and distinct patterns of cortical morphometric inverse divergence and their association with empathy in dancers and musicians.Sci Rep. 2025 Aug 5;15(1):28572. doi: 10.1038/s41598-025-13416-2. Sci Rep. 2025. PMID: 40764652 Free PMC article.
-
Mechanisms of Creativity Differences Between Art and Non-art Majors: A Voxel-Based Morphometry Study.Front Psychol. 2018 Dec 11;9:2319. doi: 10.3389/fpsyg.2018.02319. eCollection 2018. Front Psychol. 2018. PMID: 30618898 Free PMC article.
-
Spectral Characteristics of EEG during Active Emotional Musical Performance.Sensors (Basel). 2021 Nov 10;21(22):7466. doi: 10.3390/s21227466. Sensors (Basel). 2021. PMID: 34833541 Free PMC article.
References
-
- Abarbanel HD, Brown R, Sidorowich JJ, Tsimring LS (1993): The analysis of observed chaotic data in physical systems. Rev Mod Physics 65: 1331–1392.
-
- Andres FG, Mima T, Schulman AE, Dichgans J, Hallett M, Gerloff C (1999): Functional coupling of human cortical sensorimotor areas during bimanual skill acquisition. Brain 122: 855–870. - PubMed
-
- Arnheim R (1969): Visual thinking. Berkeley and Los Angeles: University of California Press.
-
- Arnhold J, Grassberger P, Lehnertz K, Elger CE (1999): A robust method for detecting interdependencies: application to intracranially recorded EEG. Physica D 134: 419–430.
-
- Bahar S, Neiman A, Wilkens LA, Moss F (2002): Phase synchronization and stochastic resonance effects in the crayfish caudal photoreceptor. Phys Rev E Stat Nonlin Soft Matter Phys 65: 050901. - PubMed
Publication types
MeSH terms
LinkOut - more resources
Full Text Sources
