

Gene expression levels assessed by oligonucleotide microarray analysis and quantitative real-time RT-PCR -- how well do they correlate?
- PMID: 15854232
- PMCID: PMC1142514
- DOI: 10.1186/1471-2164-6-59
Gene expression levels assessed by oligonucleotide microarray analysis and quantitative real-time RT-PCR -- how well do they correlate?
Abstract
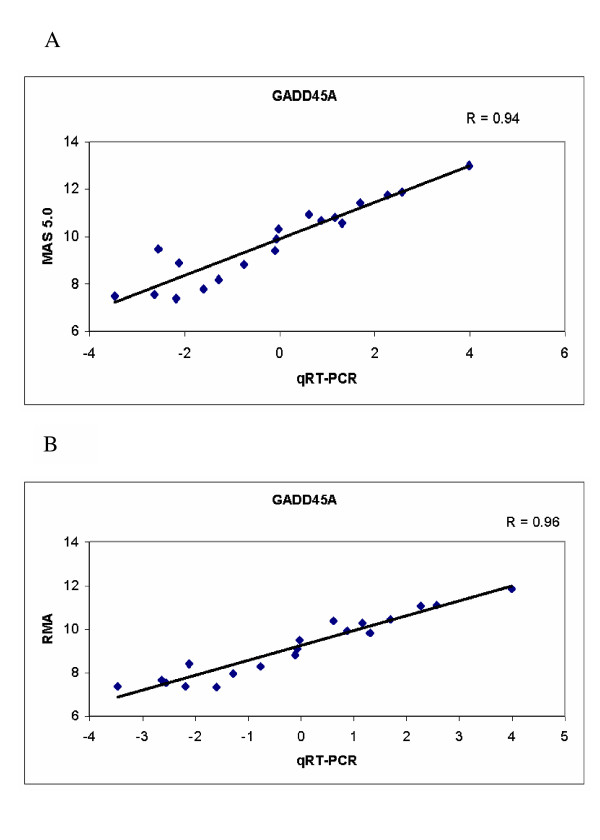
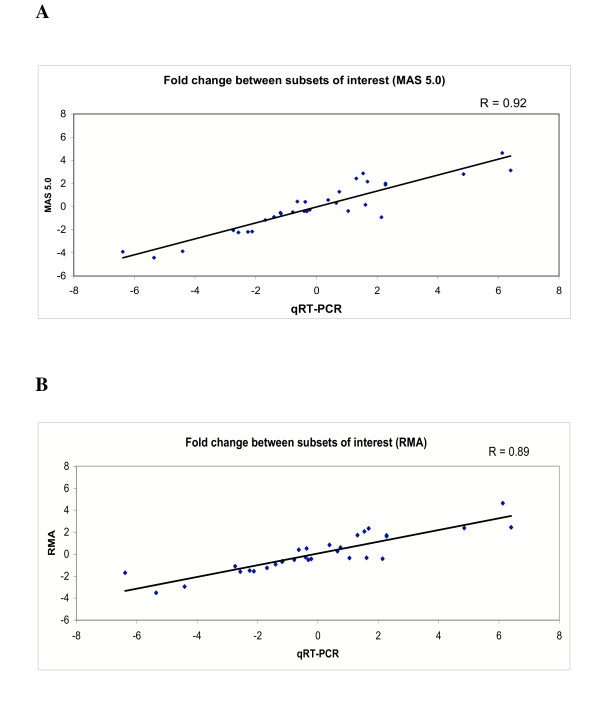
Background: The use of microarray technology to assess gene expression levels is now widespread in biology. The validation of microarray results using independent mRNA quantitation techniques remains a desirable element of any microarray experiment. To facilitate the comparison of microarray expression data between laboratories it is essential that validation methodologies be critically examined. We have assessed the correlation between expression scores obtained for 48 human genes using oligonucleotide microarrays and the expression levels for the same genes measured by quantitative real-time RT-PCR (qRT-PCR).
Results: Correlations with qRT-PCR data were obtained using microarray data that were processed using robust multi-array analysis (RMA) and the MAS 5.0 algorithm. Our results indicate that when identical transcripts are targeted by the two methods, correlations between qRT-PCR and microarray data are generally strong (r = 0.89). However, we observed poor correlations between qRT-PCR and RMA or MAS 5.0 normalized microarray data for 13% or 16% of genes, respectively.
Conclusion: These results highlight the complementarity of oligonucleotide microarray and qRT-PCR technologies for validation of gene expression measurements, while emphasizing the continuing requirement for caution in interpreting gene expression data.
Figures
References
-
- Jordan B. Historical background and anticipated developments. Ann N Y Acad Sci. 2002;975:24–32. - PubMed
Publication types
MeSH terms
Substances
Grants and funding
LinkOut - more resources
Full Text Sources
Other Literature Sources
