. 2005 Aug 1;106(3):1113-22.
doi: 10.1182/blood-2005-02-0509. Epub 2005 Apr 26.

In vivo analyses of early events in acute graft-versus-host disease reveal sequential infiltration of T-cell subsets

Affiliations

In vivo analyses of early events in acute graft-versus-host disease reveal sequential infiltration of T-cell subsets

Andreas Beilhack et al. Blood. .

Abstract

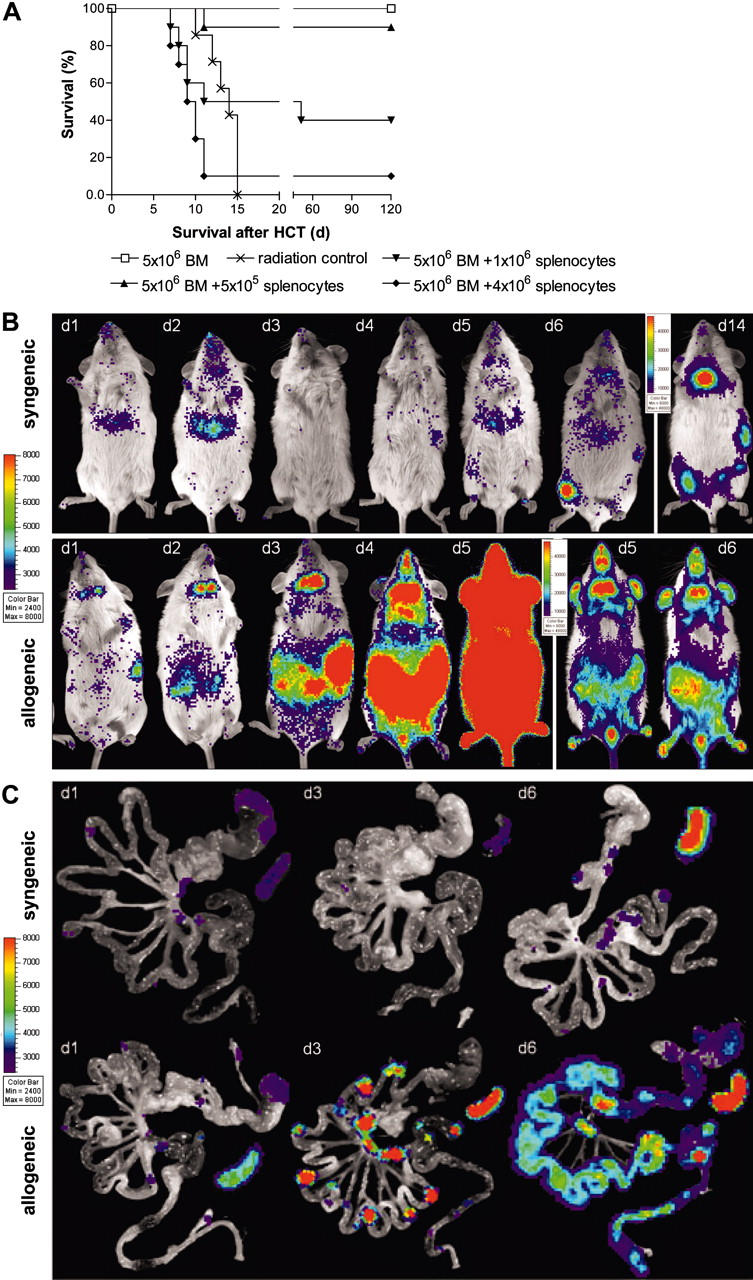
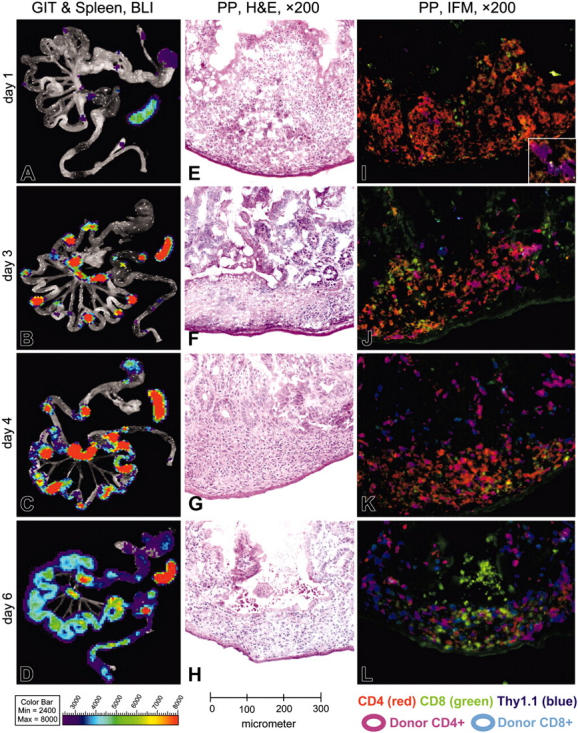
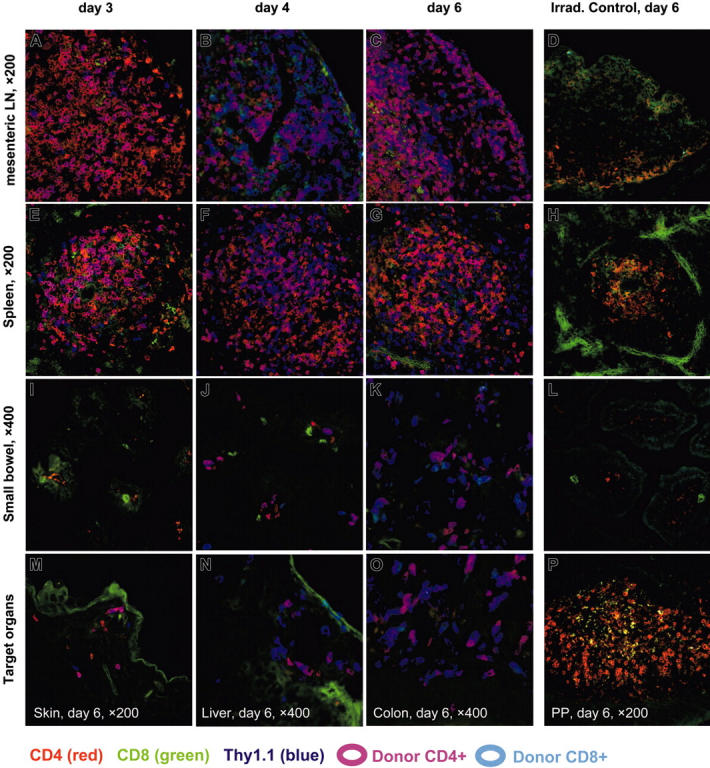
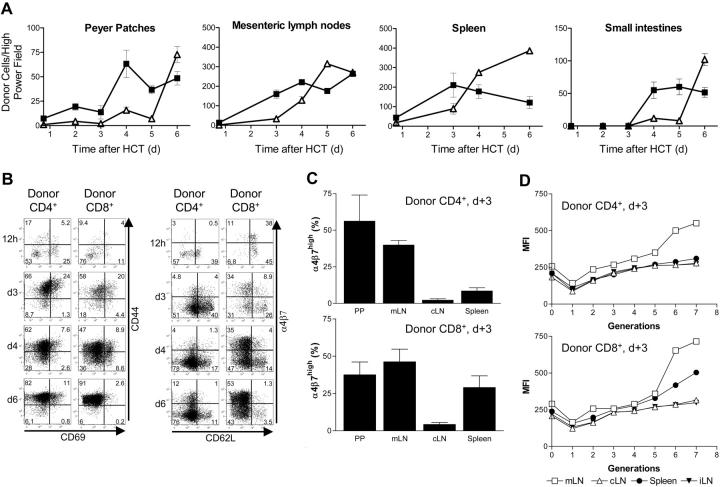
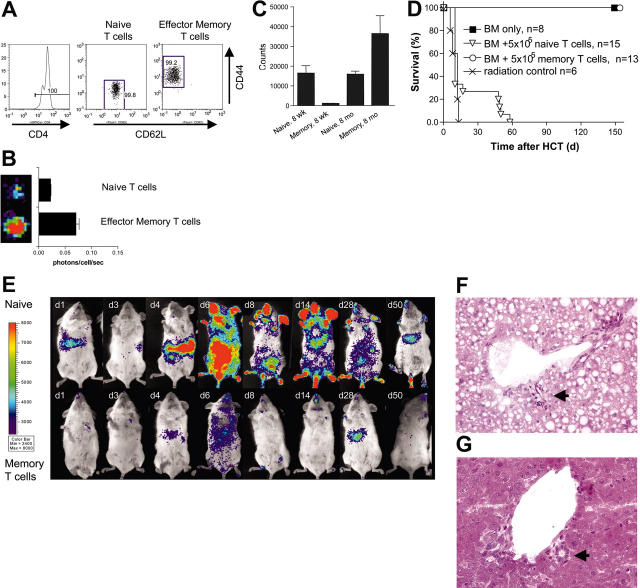
Graft-versus-host disease (GVHD) is a major obstacle in allogeneic hematopoietic cell transplantation. Given the dynamic changes in immune cell subsets and tissue organization, which occur in GVHD, localization and timing of critical immunological events in vivo may reveal basic pathogenic mechanisms. To this end, we transplanted luciferase-labeled allogeneic splenocytes and monitored tissue distribution by in vivo bioluminescence imaging. High-resolution analyses showed initial proliferation of donor CD4+ T cells followed by CD8+ T cells in secondary lymphoid organs with subsequent homing to the intestines, liver, and skin. Transplantation of purified naive T cells caused GVHD that was initiated in secondary lymphoid organs followed by target organ manifestation in gut, liver, and skin. In contrast, transplanted CD4+ effector memory T (T(EM)) cells did not proliferate in secondary lymphoid organs in vivo and despite their in vitro alloreactivity in mixed leukocyte reaction (MLR) assays did not cause acute GVHD. These findings underline the potential of T-cell subsets with defined trafficking patterns for immune reconstitution without the risk of GVHD.


Figures

Figure 1.
Figure 1.
Transplantation of transgenic luciferase+ splenocytes. (A) Transplantation of allogeneic FVB/N splenocytes induces acute lethal GVHD in a cell dose dependent manner. All animals that received transplants of 5 × 10⁶ allogeneic bone marrow cells (□; n = 10) survive without GVHD, whereas mice receiving lethal irradiation (800 rad) without subsequent HCT die of the consequences of myeloablation (×; n = 7). HCT recipients that received transplants of 5 × 10⁶ allogeneic bone marrow plus 5 × 10⁵ allogeneic splenocytes (▴; n = 10), or plus 1 × 10⁶ allogeneic splenocytes (▾; n = 10) develop acute GVHD. Mice that received transplants of bone marrow plus 4 × 10⁶ allogeneic splenocytes die of lethal acute GVHD within 2 weeks after HCT (♦;n = 10). Displayed are pooled results from 2 independent experiments. (B) BLI and (C) ex vivo imaging demonstrate a dynamic process of cell proliferation and migration with distinct distribution patterns in syngeneic versus allogeneic HCT recipients. Syngeneic splenocytes (top row) home initially predominantly to the liver and display signs of hematopoietic engraftment by day 6. By day 14, syngeneic HCT display predominant signals from the bone such as femura, pelvis, and sternum, but also spleen and thymus. Allogeneic transplanted splenocytes (bottom panel) initially proliferate in secondary lymphoid organs before infiltrating the intestines at day 4, liver and skin (ears) between day 5 and 6. Animals with an oversaturating light signal are displayed with increased signal thresholds to resolve the predominant organ distribution. One representative animal for each group is shown over time. Ex vivo imaging of the gastrointestinal tract and spleen of syngeneic animals (C, top row) reveals only transient migration of splenocytes to Peyer patches and mesenteric lymph nodes but an increase of light emission from the spleen. In contrast, allogeneic splenocytes (C, bottom row) migrate to and proliferate in these lymphoid organs before infiltrating mucosal sites. Signals from the entire intestines start to peak at day 6 before animals succumb to acute lethal GVHD.
Figure 2.
Figure 2.
BLI of gastrointestinal tissues and spleen combined with histology and immunofluorescence microscopy of Peyer patches during induction of acute GVHD. (A-D) Until day 3 after allogeneic HCT, BLI signals increase over Peyer patches (PPs), mesenteric lymph nodes (mLNs) and the spleen, while staying confined to these organs. Day 4 represents a transition, showing spread of BLI signals within the small bowel, preferentially in areas adjacent to PPs. Day 6 shows a diffuse BLI signal, covering the entire GIT. BLI signal increased over the spleen until day 3 and remained highly positive until day 6. (E-H) In H&E staining, the PPs of day 1 show irradiation-induced necrosis of B-cell follicles surrounded by large macrophages loaded with nuclear debris, which showed a high degree of green autofluorescence (compare panels I-L). Between days 3 and 4 the B-cell follicles disappear completely and are replaced by histiocytic infiltrates, while the T-cell zones appear to be conserved. On day 6 the architecture of PPs is further disturbed by a collapse of dome regions, leaving behind a flat structure, diffusely infiltrated by lymphocytes. (I-L) Triple-color staining performed with CD4-PE (red), CD8-FITC (green), and Thy1.1-APC as donor-specific marker (blue). CD4+ donor T cells specifically home to parafollicular T-cell areas of PPs within 1 day after transfer of splenocytes, while completely sparing subepithelial dome regions and B-cell follicles. Donor-derived CD4+ T cells clearly dominate in PPs over CD8+ T cells until day 3 and stay confined to the T-cell areas. The transition on day 4 shows a diffuse emigration of donor T cells, which become visible in the small bowel mucosa and submu-cosa adjacent to the PPs. On day 6 the PPs and other parts of the intestinum are diffusely infiltrated by donor T cells, now predominantly CD8+.
Figure 3.
Figure 3.
Triple-color immunofluorescence microscopy (IFM) of secondary lymphatic tissues and GVHD target organs. IFM was performed using 3 T-lymphocyte markers (antibody-conjugates): CD4-PE (red), CD8-FITC (green), and the donor-specific T-cell marker Thy1.1-APC (blue). Fresh frozen tissues sampled on 3 time points after transfer of allogeneic splenocytes (3, 4, and 6 days) are shown for mesenteric lymph nodes (mLNs) (panels A-C), spleen (panels E-G), and small bowel (panels I-K). Lymphatic tissues of day 3 (panels A,E) display a predominant infiltration by CD4+ donor T cells, which are confined to the corresponding T zones of mLNs and spleen, while target organs of day 3 remain negative for donor T cells. Day 4 represents a dramatic change in that the small bowel mucosa as a GVHD target tissue (panel J) is now infiltrated by donor T lymphocytes, predominantly CD4+, while lymphatic organs (panels B,F) shift to an expansion of CD8+ donor T cells (compare also Figure 4A). On day 6 all relevant GVHD target tissues are infiltrated by donor T cells, now predominantly CD8+, which are frequently in contact with CD4+ T cells of donor origin and sporadically with host CD4+ T cells (panels K,M-O). CD4+ and CD8+ T cells of host origin have mostly disappeared in mLNs, spleen, and small bowel of control tissues of Balb/c mice on day 6 after irradiation, which had not received an allogeneic transplantion (panels D,H,L). In contrast, PP samples of this control mouse show numerous CD4+ host T cells, which display a distinct membrane staining (panel P). The costaining for Thy1.1 was negative on all of the control tissues.
Figure 4.
Figure 4.
Evaluation of infiltrating donor-derived T cells in allogeneic target tissues. (A) Allogeneic CD4+ T cells precede the increase of donor CD8+ T cells in lymphoid organs during GVHD initiation. Shown are absolute numbers of donor-derived T cells in high-power fields (HPFs) by IFM. The shift from donor CD4+ (▪) to CD8+ T cells (▵) occurred first in the spleen on day 4 and later in other lymphoid organs. Donor CD4+ T cells appear in the small intestines after extensive proliferation in lymphoid organs not earlier than day 4 after HCT followed by infiltrating cytotoxic T cells (Standard deviation was calculated using cell counts from 3 to 4 HPFs of 2 experimental mice for each time point). (B) FACS analysis of donor (H-2Kq+) lymphocytes reveals changes in expression profiles of activation and homing markers. The up-regulation of CD69 in donor CD4+ and CD8+ T cells is followed by CD44 expression. Up-regulation of α4β7 differs between donor CD4+ and CD8+ T cells in the spleen. Shown is a representative experiment (of 2-3 independent experiments) in which cells were pooled from the spleens of allogeneic transplant recipients (n = 3-5/time point). The numbers in each quadrant represent percentages of cells. (C) Donor CD4+ T cells with gut-homing potential appear in PPs and mLNs until day 3 after HCT before donor CD4+ T cells start to appear in mucosal sites of the intestines. On day 3 after HCT the frequency of α4β7hi donor CD4+ T cells in PPs and mLNs is significantly higher in cells primed in vivo by PPs and mLNs versus spleen and cLNs. α4β7hi donor CD8+ T cells can be found in the spleen in addition to PPs and mLNs, but only a few are found in cLNs. Error bars indicate the standard deviation of 3 independent experiments. (D) CFSE proliferation analysis demonstrated that it takes more than 5 cell divisions before up-regulation of α4β7 integrin occurred in mLNs (> 98% of all α4β7hi). Peripheral LNs such as cLNs and iLNs do not contain gut-homing T cells. (PPs are not shown because of too-low cell yields for CFSE analysis.)
Figure 5.
Figure 5.
Allogeneic CD4+ TEM cells of aged mice are highly alloreactive in vitro without causing GVHD in vivo. (A) MACS-enriched CD4+ T cells (FVB/N-L2G85, H-2q) were sorted upon the expression of CD44loCD62Lhi (naive CD4+ T cells) and CD44hiCD62Llo (effector memory CD4+ T cells [TEM]) and transplanted with 5 × 10⁶ FVB/N wild-type bone marrow cells into lethally irradiated Balb/c recipients (H-2d). Cell purity of these populations exceeded more than 99% (numbers on plots represent percentages of cells). (B) Naive CD4+ T cells emit less light than CD4+ TEM cells. 105 CD4+ T-cell subsets were FACS sorted and bioluminescence quantified (error bars indicate SD of triplicates). (C) FACS-sorted CD4+ TEM cells of old donor animals showed a strong alloreactive response to irradiated splenocytes in MLR experiments (105 sorted TEM cells from 8-month-old FVB/N donors against Balb/c). Interestingly, CD4+ TEM cells of young donor mice (8 weeks old) did not show an alloresponse in vitro. In contrast, naive CD4+ T cells were alloreactive in this MLR independent of age of the donor (8-10 weeks vs 8-10 months). The bars represent the means of triplicate values and the brackets indicate SDs. One of 3 experiments with similar results is shown. (D) All allogeneic recipients of transplants of either bone marrow cells alone or bone marrow cells plus CD4+ TEM cells of 8-month-old donors survived and performed well without any signs of GVHD until the end of the observation period. Animals that received allogeneic naive CD4+ T cells and bone marrow all died of acute GVHD, either within 14 days or between days 40 to 60 after HCT. (E) Naive CD4+ T cells of 8-month-old donor mice displayed similar proliferation and migration patterns as animals given transplants of whole splenocytes. Early gut infiltration is correlated with severe acute GVHD and early mortality. Although mice that survived more than 2 weeks after HCT show a decrease of the abdominal BLI signal, they displayed clinical signs of GVHD and persistent luc+ T cells in liver and skin measured by BLI. One representative animal is shown from the latter category surviving until day 55. Allogeneic CD4+ TEM cells undergo only a very limited cell proliferation phase until day 6 and home preferentially to the liver. (F) Liver sample of an animal that had received naive CD4+ T lymphocytes (day 6 after transfer) showed severe damage of the bile duct epithelia (arrow), indicative of grade IV GVHD of the liver. Dispersed in periductular and perivascular regions of portal triads, lymphocyte infiltration was observed (compare Figure 3N). In addition, the liver samples of this group showed mixed fatty changes of hepatocytes and hydropic degeneration. (G) Liver samples of mice that had received allogeneic CD4+ TEM cells of 8-month-old donors displayed intact bile ducts with a regular epithelial lining (arrow). No signs of inflammation were detected and hepatocytes looked normal, while only single lymphocytes were visible in perivascular regions. Images in panels F and G show hematoxylin-eosin stains at 200× magnification.

Similar articles

Cited by

References

    1. Horrowitz M. Uses and growth of hematopoietic cell transplantation. In: Thomas ED, Blume KG, Forman SJ, Appelbaum FR, eds. Thomas' Hematopoietic Cell Transplantation. Malden, MA: Blackwell; 2004: 9-15.
    1. Appelbaum FR. Haematopoietic cell transplantation as immunotherapy. Nature. 2001;411: 385-389. - PubMed
    1. Shizuru JA. The experimental basis for hematopoietic cell transplantation for autoimmune diseases. In: Thomas ED, Blume KG, Forman SJ, Appelbaum FR, eds. Thomas' Hematopoietic Cell Transplantation. Malden, MA: Blackwell; 2004: 324-343.
    1. Sykes M, Sachs DH. Mixed chimerism. Philos Trans R Soc Lond B Biol Sci. 2001;356: 707-726. - PMC - PubMed
    1. Ferrara JL, Deeg HJ, Division of Pediatric Oncology D-FCIBMA. Graft-versus-host disease. N Engl J Med. 1991;324: 667-674. - PubMed

Publication types