. 2005 Aug 15;106(4):1296-304.
doi: 10.1182/blood-2005-03-0998. Epub 2005 Apr 26.

The transcription factor Gli3 regulates differentiation of fetal CD4- CD8- double-negative thymocytes

Affiliations

The transcription factor Gli3 regulates differentiation of fetal CD4- CD8- double-negative thymocytes

Ariadne L Hager-Theodorides et al. Blood. .

Abstract

Glioblastoma 3 (Gli3) is a transcription factor involved in patterning and oncogenesis. Here, we demonstrate a role for Gli3 in thymocyte development. Gli3 is differentially expressed in fetal CD4- CD8- double-negative (DN) thymocytes and is most highly expressed at the CD44+ CD25- DN (DN1) and CD44- CD25- (DN4) stages of development but was not detected in adult thymocytes. Analysis of null mutants showed that Gli3 is involved at the transitions from DN1 to CD44+ CD25+ DN (DN2) cell and from DN to CD4+ CD8+ double-positive (DP) cell. Gli3 is required for differentiation from DN to DP thymocyte, after pre-T-cell receptor (TCR) signaling but is not necessary for pre-TCR-induced proliferation or survival. The effect of Gli3 was dose dependent, suggesting its direct involvement in the transcriptional regulation of genes controlling T-cell differentiation during fetal development.


Figures
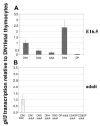
Figure 1
Figure 1. Transcription of Gli3 in fetal and adult thymic subsets.
(A) Transcription of Gli3 was assessed by quantitative real-time RT-PCR on RNAs prepared from DN1, DN2, DN3, DN4, and DP thymocyte populations sorted from E16.5 wild-type C57BL/6 fetal thymi. Levels of Gli3 transcription shown are relative to that observed in the DN1 population and normalized for HPRT mRNA content. Maximal expression was seen in the DN4 subset. (B) Transcription of Gli3 was assessed as in panel A on RNAs prepared from adult thymocyte populations sorted from wild-type C57BL/6 mice. Gli3 transcription is absent or below levels of detection in all adult thymocyte populations.
Figure 2
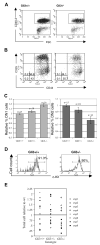
Figure 2. Expression of Gli3 is required for efficient transition from DN1 to DN2 in thymocyte development.
(A) E13.5 thymocytes isolated from Gli3+/+ and Gli3−/− mice were gated on positive expression of the hematopoietic lineage-specific marker, CD45.2, to exclude cells of a nonhematopoietic origin from the analysis. (B) DN1 is overrepresented and DN2 underrepresented in E13.5 Gli3−/− mice. CD45.2+ cells were analyzed for expression of CD44 and CD25. The percentages of DN1 to DN4 subsets are shown. Quadrants were defined according to DN subsets in E16.5 wild-type thymus. (C) Data from 8 litters showing the mean relative percentages of DN1 and DN2 cells in Gli3−/−, Gli3+/−, and Gli3+/+ E13.5 embryos, expressed relative to the mean of the Gli3+/+ littermates. Error bars represent standard error of the mean. (D) The c-kit expression was analyzed on E13.5 CD45.2+ thymocytes from Gli3+/+ (left) and Gli3−/− embryos (right). Percentages of CD45.2+c-Kit+ thymocytes are shown. (E) Thymocyte number isolated from E13.5 Gli3+/+, Gli3+/−, and Gli3−/− embryos. There were no significant differences between genotypes.
Figure 3
Figure 3. Reduced transition from DN to DP thymocytes in E16.5 Gli3+/− and Gli3−/− mice.
(A) Thymocytes from Gli3+/+, Gli3+/−, and Gli3−/− mice were isolated and stained for expression of the cell surface markers, CD4 and CD8. Percentage of thymocytes in each quadrant is shown. (B) Data from multiple litters represented in panel A are shown graphically. The mean percentage of DN, CD8+ ISP, and DP thymocytes relative to the corresponding mean percentage in wild-type littermates for each litter are shown in the left, middle, and right panels, respectively. P values for the comparisons between the mean values of Gli3−/− and Gli3+/−, between Gli3+/− and Gli3+/+, and between Gli3−/− and Gli3+/+ were all less than .05. (C) Expression of CD2 on thymocytes isolated from E16.5 Gli3+/+, Gli3+/−, and Gli3−/− mice. A reduction in CD2 expression accompanies the reduction in CD8 ISP and DP thymocyte populations seen in Gli3+/− and Gli3−/− mice. Histogram overlays show the expression of CD2 on total E16.5 thymocytes (shaded curves), DN cells (thin lines), and CD8 ISP cells (bold lines). Percentages of total thymocytes positive for CD2 are shown. (D) Data from multiple experiments as shown in panel C. The results are expressed as relative mean percentage of CD2 expression in thymocyte DN, CD8 ISP, and DP populations relative to the wild-type control. Error bars in panels B and D represent the standard error of the mean.
Figure 4
Figure 4. Gli3 is not involved in survival, proliferation, or lineage commitment of fetal thymocytes.
(A) Thymocyte number isolated from Gli3−/−, Gli3+/−, and Gli3+/+ embryos is not significantly different at embryonic days E14.5, E15.5, and E16.5. (B-C,E-F) ▪ indicates Gli3+/+; ▧, Gli3+/−; and □, Gli3−/−. Error bars represent the standard error of the mean. (B) Cell death (as measured by annexin V staining) was not significantly different in any thymocyte population isolated from E16.5 Gli3+/+, Gli3+/−, and Gli3−/− mice. (C) Cell death measured as in panel B of DN3 and DN4 cells isolated from E15.5 Gli3+/+, Gli3+/−, and Gli3−/−. No significant differences were observed. (D) Propidium iodide staining was used to assess cell-cycle status of total thymocytes isolated from E16.5 Gli3+/+, Gli3+/−, and Gli3−/− mice. Percentages of thymocytes at the G2/S phases of the cell cycle are shown. (E) Cell-cycle status analyzed by staining with DRAQ5 simultaneously with cell-surface markers for a combination of CD4, CD8, CD44, and CD25. No significant differences in cell-cycle status was observed in any thymocyte subset analyzed from E16.5 Gli3+/+, Gli3+/−, and Gli3−/− embryos. (F) Cell-cycle status of E15.5 DN3 and DN4 was analyzed as in panel E. There were no significant differences observed between Gli3+/+, Gli3+/−, and Gli3−/− embryos. (G) E16.5 thymocytes were stained with anti-TCRγδ and anti-NK1.1 antibodies. No significant differences were observed. Percentages of TCRγδ or NK1.1 CD44CD25 DN cells are shown.
Figure 5
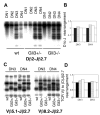
Figure 5. TCRβ locus rearrangement does not require the presence of Gli3.
(A) Southern blot hybridizations were performed on PCR products amplified using primers specific for TCRDβ2 and TCRJβ2.7 and DNA templates from DN subsets sorted from E15.5 thymus. The probe used corresponded to a germ line (unrearranged) TCRβ fragment and was obtained by radio-labeling a PCR product amplified from genomic DNA using the TCRDβ2 and TCRJβ2.7 specific oligos. PCR was performed on DN1, DN2, DN3, and DN4 thymocyte populations sorted from wt, Gli3+/−, and Gli3−/− mice. The PCR reactions were stopped when all were still in the exponential phase as determined by the titration of templates. (B) The extent of TCRβ rearrangement observed in panel A was quantified by measuring the total intensity of the 6 rearranged bands and relating back to the intensity of the germ line band (uppermost band in each panel) by dividing the total intensity of the bands corresponding to the rearranged locus by the intensity of the band corresponding to nonrearranged locus. The levels of rearrangement observed in the wt mice (▪) was set to 1 and the levels of rearrangement observed in Gli3+/− (▧) and Gli3−/− mice (□) expressed relative to this level. No reduction in TCRDβ2-Jβ2.7 rearrangement was observed in DN3 and DN4 thymic subsets isolated from Gli3+/− or Gli3−/− mice. (C) TCRβ V-(D)J rearrangements were analyzed using the same technique as in panel A, except that the PCR products were generated using 5′ primers specific to TCR Vβ5.1 (left) and TCR Vβ8.2.(right) together with the same 3′ primer to Jβ2.7 as in panel A. In addition the genomic DNA content for each extraction was calculated by real-time PCR, and the same starting template for the rearrangement PCRs was used in all reactions. The probe used was the same as in panel A. TCRβ V(D)J rearrangement had occurred in DN3 and DN4 thymic subsets isolated from wt, Gli3+/−, and Gli3−/− mice. The PCR reactions were stopped when all were still in the exponential phase as determined by the titration of templates. (D) The levels of rearrangement observed in panel C was quantified by using equivalent starting amounts of genomic DNA as determined by real-time PCR and measuring the total intensity of all the bands and relating this amount back to that observed in DNA isolated from the wt mouse. No significant differences were observed in the level of TCRβ V(D)J rearrangement observed in wt (▪), Gli3+/− (▧), and Gli3−/− (□) mice.
Figure 6
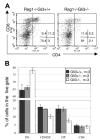
Figure 6. Gli3 is downstream of pre-TCR signaling for thymocyte differentiation.
(A) Two-day FTOCs of E15.5 Rag1−/−Gli3−/− and Rag1−/−Gli3+/+ thymi with anti-CD3 antibody were performed and stained for CD4 and CD8 expression. The percentage of DP thymocytes was reduced in Rag1−/−Gli3−/− relative to the Rag1−/−Gli3+/+ control. Percentages of thymocytes in each quadrant are shown. (B) Mean percentages of DN, CD8 ISP, DP, and SP CD4 cells induced in the Rag1−/−Gli3+/+, Rag1−/−Gli3+/−, and Rag1−/−Gli3−/− FTOCs treated with anti-CD3 are shown. The differences observed between Rag1−/−Gli3+/+ and Rag1−/−Gli3−/− are statistically significant according to Student t test P values (< .05). Error bars represent the standard error of the mean.

Similar articles

Cited by

References

    1. Rothenberg EV. T-lineage specification and commitment: a gene regulation perspective. Semin Immunol. 2002;14:431–440. - PubMed
    1. Michie AM, Zuniga-Pflucker JC. Regulation of thymocyte differentiation: pre-TCR signals and beta-selection. Semin Immunol. 2002;14:311–323. - PubMed
    1. Matise MP, Joyner AL. Gli genes in development and cancer. Oncogene. 1999;18:7852–7859. - PubMed
    1. Koebernick K, Pieler T. Gli-type zinc finger proteins as bipotential transducers of Hedgehog signaling. Differentiation. 2002;70:69–76. - PubMed
    1. Ingham PW, McMahon AP. Hedgehog signaling in animal development: paradigms and principles. Genes Dev. 2001;15:3059–3087. - PubMed

Publication types

MeSH terms