Comparative Study
. 2005 May;166(5):1427-39.
doi: 10.1016/S0002-9440(10)62360-7.

Kinetics of disease progression and host response in a rat model of bubonic plague

Affiliations
Comparative Study

Kinetics of disease progression and host response in a rat model of bubonic plague

Florent Sebbane et al. Am J Pathol. 2005 May.

Abstract

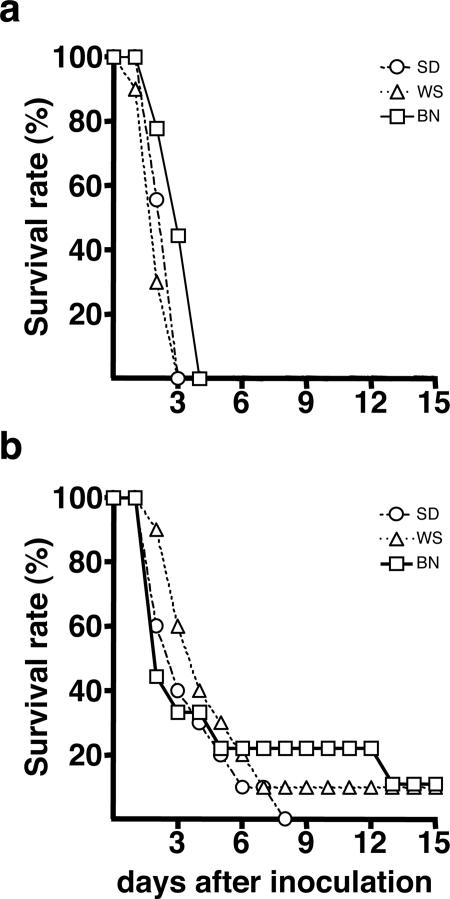
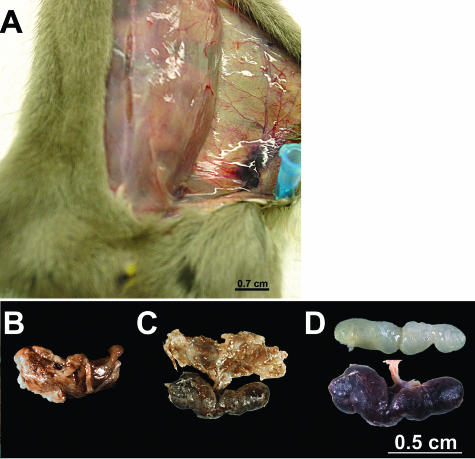
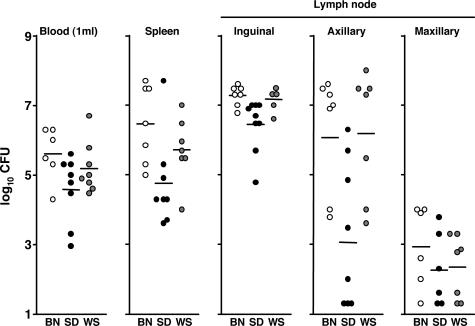
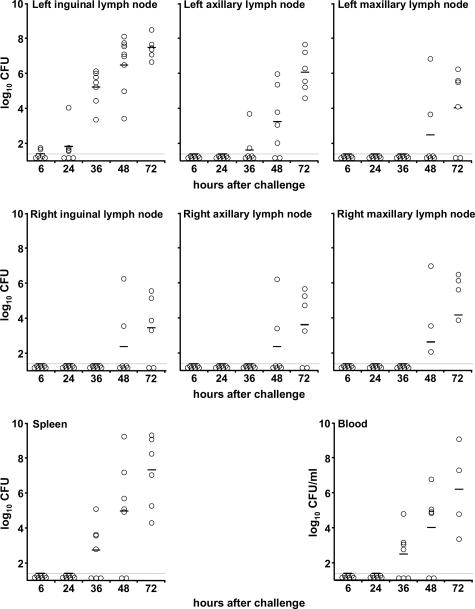
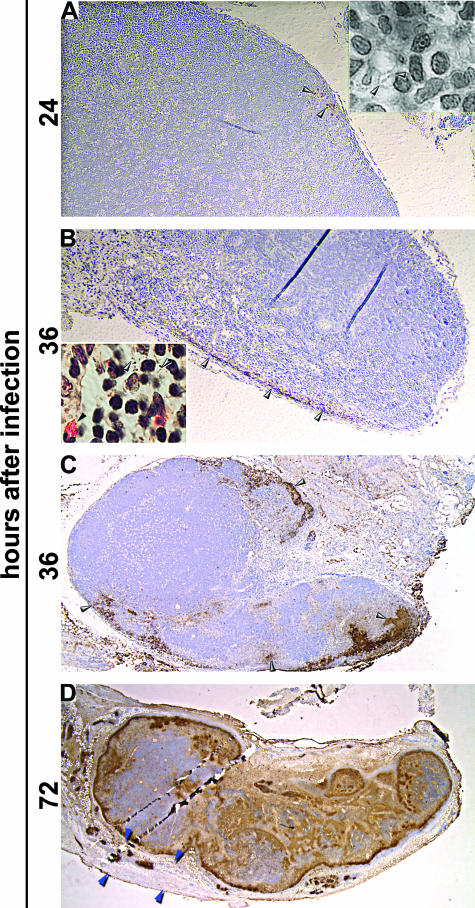
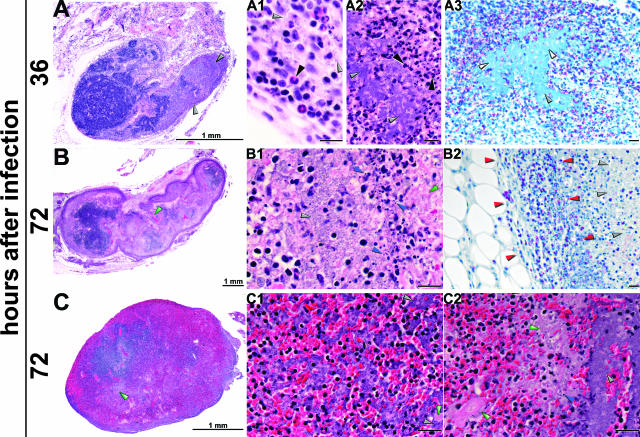
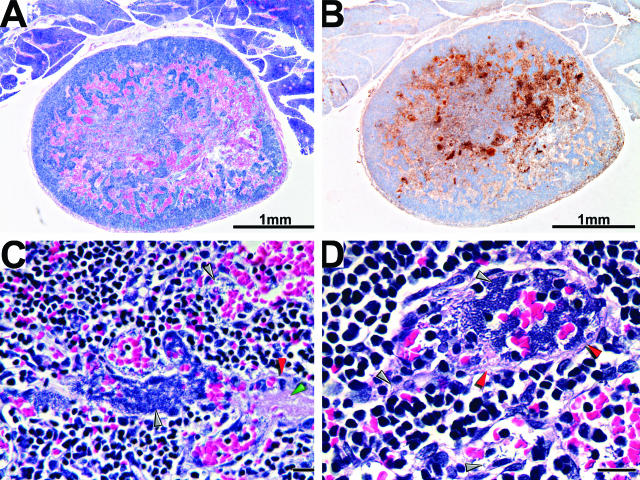
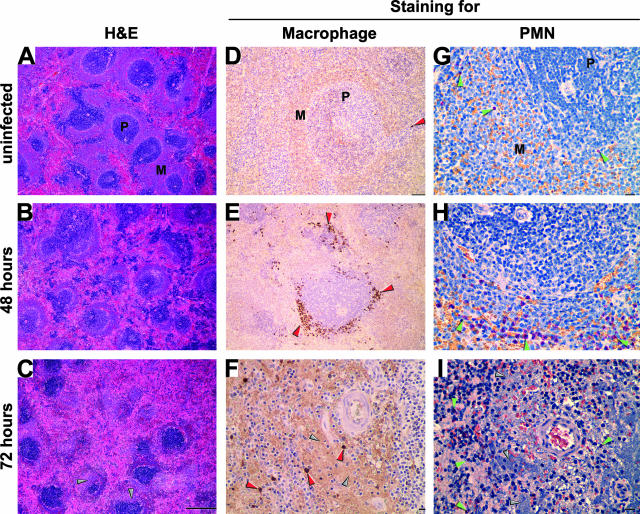
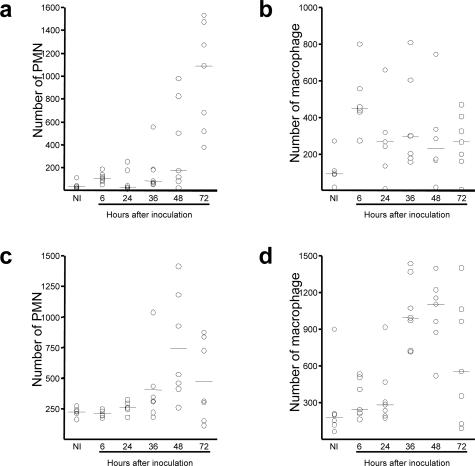
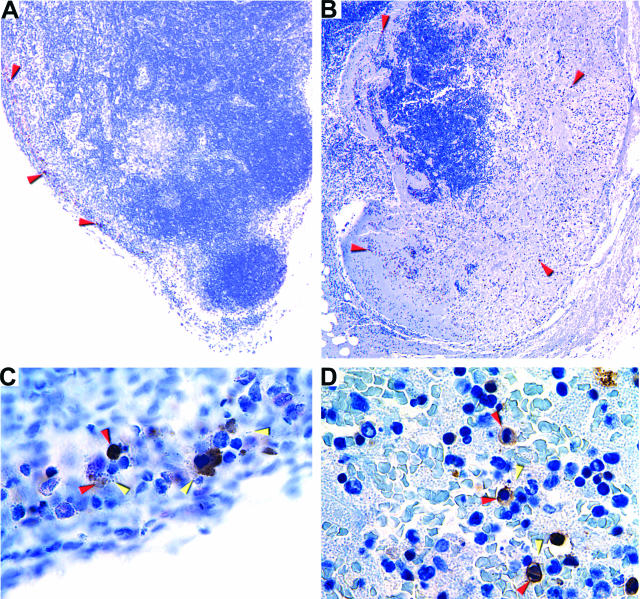
Plague, caused by the gram-negative bacterium Yersinia pestis, primarily affects rodents but is also an important zoonotic disease of humans. Bubonic plague in humans follows transmission by infected fleas and is characterized by an acute, necrotizing lymphadenitis in the regional lymph nodes that drain the intradermal flea bite site. Septicemia rapidly follows with spread to spleen, liver, and other organs. We developed a model of bubonic plague using the inbred Brown Norway strain of Rattus norvegicus to characterize the progression and kinetics of infection and the host immune response after intradermal inoculation of Y. pestis. The clinical signs and pathology in the rat closely resembled descriptions of human bubonic plague. The bacteriology; histopathology; host cellular response in infected lymph nodes, blood, and spleen; and serum cytokine levels were analyzed at various times after infection to determine the kinetics and route of disease progression and to evaluate hypothesized Y. pestis pathogenic mechanisms. Understanding disease progression in this rat infection model should facilitate further investigations into the molecular pathogenesis of bubonic plague and the immune response to Y. pestis at different stages of the disease.


Figures

Figure 1
Figure 1
Incidence of terminal plague in rats injected ID with ∼500 CFU of Y. pestis 195/P. Groups of 9 to 10 rats were inoculated in the lower lumbar region (a) or in the ear (b). BN, Brown Norway; SD, Sprague-Dawley; WS, Wistar rat strains.
Figure 2
Figure 2
Typical bubo formation in the Brown Norway rat. A: Enlarged left inguinal lymph node surrounded by edema and hemorrhage 3 days after ID inoculation of ∼500 Y. pestis in the left lower back. B to C: Dissected bubo before (B) and after (C) removal of the surrounding gelatinous capsule. D: Comparison of the uninfected normal right inguinal lymph node (top) and necrotic enlarged left inguinal lymph node (bottom) dissected from the rat shown in A.
Figure 3
Figure 3
Bacterial load in rat blood, spleen, and lymph nodes at the terminal stage of plague. Y. pestis CFU counts from individual Brown Norway (BN, open circles), Sprague-Dawley (SD, closed circles), and Wistar (WS, gray circles) rats are indicated. Horizontal bars indicate the mean of the individual data points.
Figure 4
Figure 4
Kinetics of colonization and bacterial load in the Brown Norway rat. Open circles indicate Y. pestis CFU counts in left and right inguinal, axillary and maxillary lymph nodes, the spleen, and the blood of individual rats at different times after ID injection of ∼600 Y. pestis in the left lower back. The dashed line indicates the detection limit (15 CFU), and horizontal lines indicate the mean CFU per tissue.
Figure 5
Figure 5
Progression of Y. pestis infection in the lymph node draining the inoculation site. Sections of proximal inguinal lymph nodes collected at 24 (A), 36 (B and C), and 72 (D) hours after intradermal infection stained by IHC using Y. pestis-specific antibody. Insets: magnification (×1000) of H&E-stained sections of the same lymph nodes. Gray arrowheads indicate extracellular bacteria, which stain brown by IHC. Black arrowheads indicate PMNs. The mature bubo (D) is surrounded by a gelatinous perinodal capsule (delimited by the blue arrowheads) containing bacteria. Magnification, ×10 (A and B); ×4 (C); and ×1.5 (D).
Figure 6
Figure 6
Progression of histopathology in the primary bubo. Sections of proximal lymph nodes collected at 36 (A) and 72 (B and C) hours after intradermal inoculation of ∼300 Y. pestis were stained by H&E (A, A1 and A2; B, B1; and C, C1 and C2) or by Naphthol AS-D chloroacetate esterase, which stained PMNs (A3 and B2). Gray arrowheads indicate individual extracellular bacteria (A1) or bacterial aggregates, which appear as fields of blue (A3) or purple (A, A2, B1, C1, and C2). PMNs stain red by chloroacetate esterase (A3 and B2) and were localized at the periphery of the lymph node (delimited by red arrowheads in B2) and surrounded the bacterial aggregates. PMNs in H&E sections are indicated by black arrowheads (A1 and A2). Fibrin appears as deposits of pink color, indicated by green arrowheads (B, B1, C, C1, and C2). Blue arrowheads show cellular debris and condensed, degraded nuclei, indicative of necrosis or apoptosis (B1 and C2). Unlabeled scale bars, 20 μm.
Figure 7
Figure 7
Histopathology of distal lymph node infected by hematogenous spread (secondary bubo). Section of an infected right maxillary lymph node was stained by H&E (A, C, and D) or by IHC using Y. pestis-specific antibody (B). Bacteria (stained brown by IHC) colocalize with areas of hemorrhage (stained red by H&E), which appeared to be the consequence of vasculitis. Infected, disrupted blood vessels, indicated by red arrowheads (C and D) contain intra- and perivascular bacterial aggregates (dark purple areas indicated by gray arrowheads), fibrin deposits (pink areas indicated by green arrowheads), and hemorrhage. Unlabeled scale bars, 20 μm.
Figure 8
Figure 8
Progression of the histopathology in the spleen. Sections of spleens collected from an uninfected rat (A, D, and G) or from infected rats 48 (B, E, and H) and 72 (C, F, and I) hours after infection were stained by H&E (A to C), by IHC using an anti-rat mononuclear cell antibody (D to F), or by Naphthol AS-D chloroacetate esterase assay to detect PMNs (G to I). Macrophages (stained brown in D to F) and PMNs (stained red in G to I) were concentrated at the marginal zone and are indicated by red and green arrowheads, respectively. Bacterial aggregates close to the arteriole of the PALS appear purple (C), light brown (F), or blue (I) and are indicated by gray arrowheads. P, periarterial lymphatic sheath; M, marginal zone. Scale bar, 500 μm (A to C), 100 μm (D and E), and 20 μm (F to I).
Figure 9
Figure 9
Kinetics of PMN and macrophage recruitment to lymph node (a and b) and spleen (c and d). Open circles indicate the number of cells in one entire lymph node section or in 50 fields of a spleen section from individual rats, counted at 600× magnification. NI, noninfected.
Figure 10
Figure 10
Apoptosis in the primary bubo. Caspase-3-positive cells in sections of inguinal lymph nodes collected at 36 (A and C) and 72 (B and D) hours after infection were detected by IHC. Brown-colored apoptotic cells colocalized with Y. pestis in the marginal sinus (A and C) and later in colonized regions throughout the lymph node parenchyma (B and D). Red and yellow arrowheads indicate examples of apoptotic cells and bacteria, respectively. Original magnification, ×30 (A); ×80 (B); ×600 (C and D).

References

    1. Pollitzer R. Geneva: World Health Organization,; Plague. 1954 - PubMed
    1. Butler T. Plague and Other Yersinia Infections. New York: Plenum Press,; 1983
    1. Crowell BC. Pathologic anatomy of bubonic plague. Philipp J Sci. 1915;10:249–306.
    1. Flexner S. The pathology of bubonic plague. Am J Med Sci. 1901;122:396–416.
    1. Donavan JE, Ham D, Fukui GM, Surgalla MJ. Role of the capsule of Pasteurella pestis in bubonic plague in the guinea pig. J Infect Dis. 1961;109:154–157. - PubMed

Publication types

MeSH terms

Substances