. 2005 May;166(5):1541-54.
doi: 10.1016/S0002-9440(10)62370-X.

Up-regulated expression of zonula occludens protein-1 in human melanoma associates with N-cadherin and contributes to invasion and adhesion

Affiliations

Up-regulated expression of zonula occludens protein-1 in human melanoma associates with N-cadherin and contributes to invasion and adhesion

Keiran S M Smalley et al. Am J Pathol. 2005 May.

Abstract

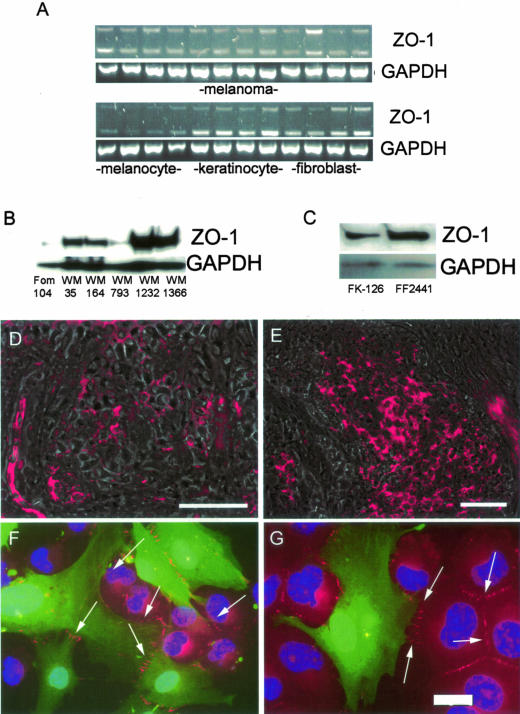
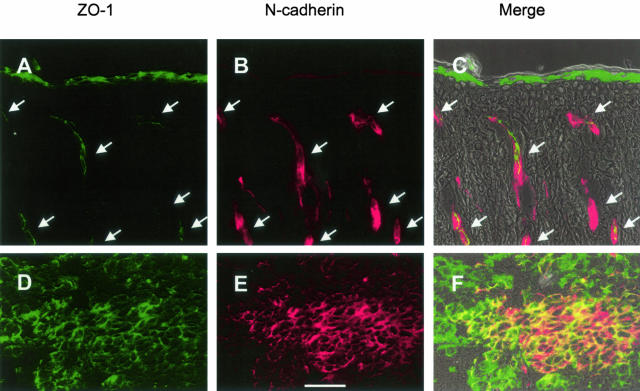
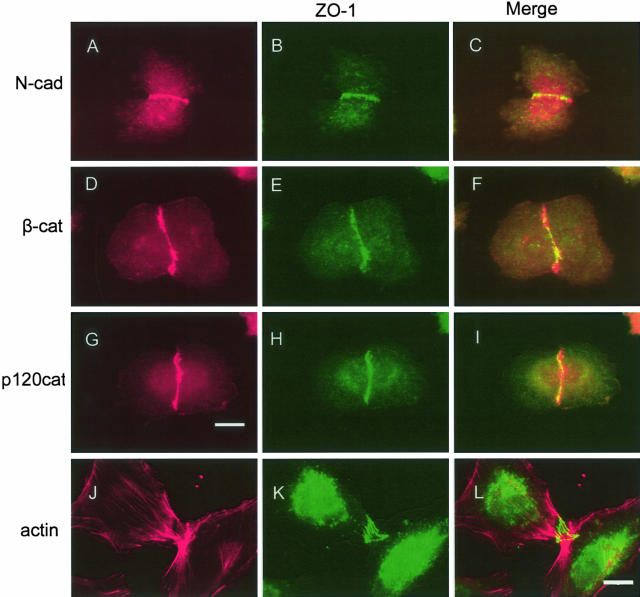
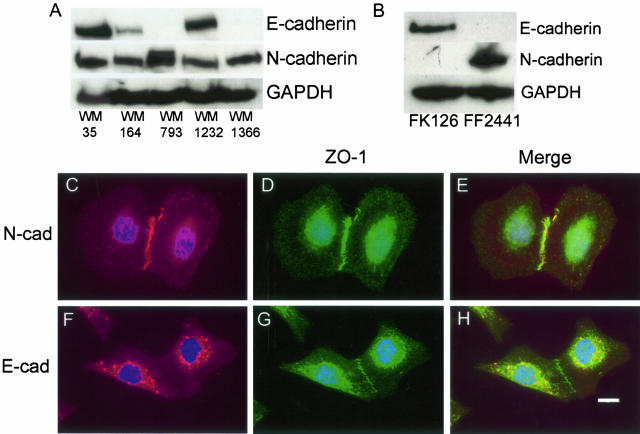
During the process of malignant transformation, nascent melanoma cells escape keratinocyte control through down-regulation of E-cadherin and instead communicate among themselves and with fibroblasts via N-cadherin-based cell-cell contacts. The zonula occludens (ZO) protein-1 is a membrane-associated component of both the tight and adherens junctions found at sites of cell-cell contact. In most cancers, levels of ZO-1 are typically down-regulated, leading to increased motility. Here we report the novel observation that ZO-1 expression is up-regulated in melanoma cells and is located at adherens junctions between melanoma cells and fibroblasts. Immunofluorescence and co-immunoprecipitation studies showed co-localization of ZO-1 with N-cadherin. Down-regulation of ZO-1 in melanoma cells through RNA interference produced marked changes in cell morphology--leading to a less-dendritic, more rounded phenotype. Consistent with a role in N-cadherin-based adhesion, RNAi-treated melanoma cells were less adherent and invasive when grown in a collagen gel. These data provide the first evidence that increased ZO-1 expression in melanoma contributes to the oncogenic behavior of this tumor and further illustrate that protein products of genes, such as ZO-1, can function in either a pro- or anti-oncogenic manner when expressed in different cellular contexts.


Figures

Figure 1
Figure 1
ZO-1 expression in skin cells and melanoma. A: RT-PCR analysis of ZO-1 RNA in melanoma cells, melanocytes, skin keratinocytes, and skin fibroblasts. The upper band shows the α+ splice variant of ZO-1 and the lower band shows the α− splice variant. Equal RNA loading was confirmed by performing RT-PCR to GAPDH. B: Western blot analysis of ZO-1 protein in melanocytes (FOM 104) and melanoma (WM35-WM1366). Even protein loading was confirmed by reprobing the membrane with antibody to GAPDH. C: Western blot showing expression of ZO-1 in keratinocytes (FK126) and fibroblasts (FF2441). D and E: Immunofluorescence microscopy (overlay of epifluorescence and corresponding phase contrast) of ZO-1 in a junctional nevus (D) and a VGP melanoma (E). F and G: Immunofluorescence microscopy of ZO-1 staining (red, indicated with arrows) between melanoma cells (red) and GFP-tagged human dermal fibroblasts (green). Scale bars: 50 μm (D, E); 20 μm (G).
Figure 2
Figure 2
Expression of ZO-1 in human skin and metastatic melanoma. A–C: Localization of ZO-1 and N-cadherin in human scalp skin. D–F: Localization of ZO-1 and N-cadherin in melanoma metastasis. Immunofluorescence microscopy of ZO-1 is shown in green (A, C, D, F). Expression of N-cadherin is shown in red (B, C, E, F). The corresponding overlay of epifluorescence and phase contrast is shown in C and F. The arrows shown in A to C denote blood vessels. Scale bar, 50 μm.
Figure 3
Figure 3
Co-localization of ZO-1 with adherens junction proteins in human melanoma cells. Cells were stained in red with antibodies to N-cadherin (N-Cad; A, C), β-catenin (β-cat; D, F), p120catenin (p120cat; G, I), or actin (J, L). B, C, E, F, H, I, K, L: The same cells were also co-stained in green with antibodies to ZO-1. Scale bars: 20 μm (A–I); 4 μm (J–L).
Figure 4
Figure 4
Expression of adherens and tight-junction proteins in melanoma, keratinocytes, and fibroblasts. Western blot analysis of protein extracts from melanoma cells (WM35, WM1366, and 1205Lu), keratinocytes (FK126), and fibroblasts (FF2441). Blots were probed with antibodies to α-catenin, β-catenin, plakoglobin (γ-catenin), p120catenin, occludin, claudin-7, and GAPDH. Experiments were performed at least three times and the figure shows representative blots. In each case, blots were stripped and reprobed for GAPDH to demonstrate equal protein loading.
Figure 5
Figure 5
Localization of both N-cadherin and ZO-1 to cell-cell adhesions requires the presence of calcium. A and C: WM1366 cells grown in 2% melanoma media were stained in red with antibodies to N-cadherin. B and C: Cells were also co-stained in green with antibodies to ZO-1. After a 15-minute treatment with calcium-free EDTA containing melanoma media both N-cadherin (D, F) and ZO-1 (E, F) disappeared from the points of cell-cell adhesion. After being returned to normal, calcium-containing media for 30 minutes both N-cadherin (G, I) and ZO-1 (H, I) returned to the points of cell-cell adhesion. J: Physical interaction between ZO-1 and N-cadherin, as demonstrated by co-immunoprecipitation. Whole cell melanoma protein extracts were subject to pull down using antibodies to either ZO-1 (ZO-1) or matched IgG (control), subsequent blots were then probed for N-cadherin. Scale bar, 20 μm.
Figure 6
Figure 6
Expression and co-localization of E- and N-cadherin with ZO-1 in melanoma cell lines. A: Western blots showing the expression of both E- and N-cadherin in selected melanoma cells. B: Western blot showing the expression of E- and N-cadherin in skin keratinocytes (FK126) and dermal fibroblasts (FF2441). Blots are representative of three independent experiments. In each case, blots were stripped and reprobed with anti-GAPDH to confirm equal protein loading. Co-localization of N-cadherin (C, E), with ZO-1 in WM1232 melanoma cells (D, E). Co-localization of E-cadherin (F, H) with ZO-1 in WM1232 melanoma cells (G, H). Scale bar, 20 μm.
Figure 7
Figure 7
Characterization of a RNAi to knockdown ZO-1. A: RT-PCR showing knockdown of ZO-1 RNA in WM35 melanoma cells treated with lentivirus encoding Z11 clone RNAi, RT-PCRs for GAPDH were included as a control. B: Western blot showing knockdown of ZO-1 protein in Z11-infected WM35 cells, note the lack of knockdown in closely related proteins E- and N-cadherin and GAPDH. C: Reversal of the RNAi effect of the Z11 clone lentivirus through introduction of 3-point mutations into the sequence (N3). D and E: Immunofluorescence microscopic pictures showing expression of ZO-1 at cell-cell adhesions (indicated with arrows) in H1UG1 vector control cells and N3 mutant cells. F: Loss of ZO-1 expression at cell-cell adhesions in cells treated with the lentivirus for Z11 clone RNAi. Scale bar, 20 μm.
Figure 8
Figure 8
Knockdown of ZO-1, using RNAi, alters the morphology of WM35 cells. Cells infected with lentivirus for the H1UG1 vector control sequence exhibit a normal dendritic morphology when stained for cytoskeletal actin (A) or DIC (B). C: GFP staining demonstrates viral infection. D and E: In contrast to controls, Z11-infected cells are more rounded. F: GFP image demonstrates viral infection. G and I: Confocal microscopic pictures show the spreading, dendritic appearance of H1UG1 vector control cells that is lacking in the Z11 RNAi-infected cells (H, J). Scale bar, 20 μm.
Figure 9
Figure 9
Knockdown of ZO-1 in melanoma cells fails to alter localization of E- or N-cadherin but reduces melanoma invasion and strength of cell-cell adhesion. A and B: Immunofluorescence images showing similar localization of E-cadherin in both control H1UG1 (not shown), N3 and Z11lentivirus-infected cells. C and D: The localization of N-cadherin is also similar in H1UG1 (not shown), N3 and Z11 lentivirus-infected WM35 cells (indicated by arrows). E: Gentle agitation of WM35 spheroids has no effect on N3-infected WM35 cells. F: However, Z11-infected WM35 spheroids are more easily disrupted. G: Preformed H1UG1 (not shown) and N3-infected WM35 control spheroids invade into the surrounding collagen after 96 hours. H: In contrast Z11-infected WM35 cell spheroids exhibit much reduced invasion into the collagen matrix. Scale bar, 100 μm.

References

    1. Tang A, Eller MS, Hara M, Yaar M, Hirohashi S, Gilchrest BA. E-cadherin is the major mediator of human melanocyte adhesion to keratinocytes in vitro. J Cell Sci. 1994;107:983–992. - PubMed
    1. Hsu MY, Andl T, Li G, Meinkoth JL, Herlyn M. Cadherin repertoire determines partner-specific gap junctional communication during melanoma progression. J Cell Sci. 2000;113:1535–1542. - PubMed
    1. Hsu MY, Meier FE, Nesbit M, Hsu JY, Van Belle P, Elder DE, Herlyn M. E-cadherin expression in melanoma cells restores keratinocyte-mediated growth control and down-regulates expression of invasion-related adhesion receptors. Am J Pathol. 2000;156:1515–1525. - PMC - PubMed
    1. Haass NK, Smalley KSM, Herlyn M. The role of altered cell-cell communication in melanoma progression. J Mol Histol. 2004;35:309–318. - PubMed
    1. Hirohashi S. Inactivation of the E-cadherin-mediated cell adhesion system in human cancers. Am J Pathol. 1998;153:333–339. - PMC - PubMed

Publication types

MeSH terms