. 2005 Jun;3(6):e175.
doi: 10.1371/journal.pbio.0030175. Epub 2005 May 3.

Output-mode transitions are controlled by prolonged inactivation of sodium channels in pyramidal neurons of subiculum

Affiliations

Output-mode transitions are controlled by prolonged inactivation of sodium channels in pyramidal neurons of subiculum

Donald C Cooper et al. PLoS Biol. 2005 Jun.

Abstract

Transitions between different behavioral states, such as sleep or wakefulness, quiescence or attentiveness, occur in part through transitions from action potential bursting to single spiking. Cortical activity, for example, is determined in large part by the spike output mode from the thalamus, which is controlled by the gating of low-voltage-activated calcium channels. In the subiculum--the major output of the hippocampus--transitions occur from bursting in the delta-frequency band to single spiking in the theta-frequency band. We show here that these transitions are influenced strongly by the inactivation kinetics of voltage-gated sodium channels. Prolonged inactivation of sodium channels is responsible for an activity-dependent switch from bursting to single spiking, constituting a novel mechanism through which network dynamics are controlled by ion channel gating.


Figures
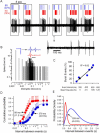
Figure 1
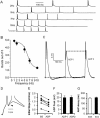
Figure 1. In Vivo Action Potential Output Mode Transition in Bursting Dorsal Subicular Neurons
(A) Representative 30-s trace shows six epochs of bursting-to-single spiking output mode transition. Each epoch began with bursts that switched to single spikes. Bursts (BS, blue) and single spike (SS, red) events were extracted from the raw data (black trace) for each cell, and the percentages of spike events (burst or single spikes) were determined. For this cell, 22% of the total events were bursts, while 78% of events were single spikes. The lower inset depicts an expansion from one epoch showing the transition from bursting to single spiking. (B) Interspike interval histogram for the neuron in (A) shows a bimodal distribution of short intervals of less than 8 ms (blue dashed lines show burst intervals), and of longer intervals between 40 and 200 ms. The arrow points to an expanded burst (blue) and single spike (red) extracellular waveform (scale bar, 2 ms). (C) A strong positive correlation was observed between the percentage of burst events and the average event interval (n = 7). The filled black circle shows the relative position of the cell from (A) and (B). (D) The cumulative probability plot shows the probabilities of total burst (45%) and single spike (55%) events across inter-event intervals for all cells (n = 7). A sigmoidal function was used to fit the data (half max SS [red] = 89 ms, BS [blue] = 378 ms). (E) Probability density plot shows the fractional probability change across the inter-event interval. The peak probability density for bursting (blue) was longer than for single spiking (red) events; the arrow indicates the interval beyond which the probability of bursting exceeds that of single spiking.
Figure 2
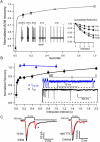
Figure 2. In Vitro Transition from Bursting to Single Spiking Output Is Frequency-Dependent
(A) A representative cell shows the typical burst-to-single spike transition in response to current injections of five sEPSCs (τdecay = 6 ms) delivered at frequencies between 2 and 10 Hz. Note: Only the 10 Hz sEPSC is shown. (B) The average number of bursts in response to five sEPSC injections delivered at frequencies of 1–10 Hz (n = 17). (C) The representative trace shows the lack of a change between the ADP peaks (ADP1 versus ADP2) that follow a burst (5 Hz) and the complete decay of the AHP before the transition from bursting to single spiking. (D and E) A representative trace (D) and averaged data (E) show that the initial slope of the ADP is decreased during the transition from bursting to single spiking at 5 Hz (n = 7). The arrow in (D) points to the beginning of the ADP slope in an overlay of a burst before and after a transition to a single spike at 5 Hz. (F) The average peak of the ADP (in the absence of a second spike) does not change during a train (5 Hz; n = 4). (G) The average decay of the AHP (time for V m to return to rest) is not different between two bursting events (B-B, n = 8) and transitions from bursting to single spike events (B-S, n = 8) at frequencies of 2–5 Hz.
Figure 3
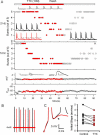
Figure 3. Transitions from Bursting to Single Spiking Output Are Mediated by Slow Recovery from Na+ Current Inactivation
(A) Filled black circles show the dV/dt of the first action potential response to the fifth suprathreshold sEPSC input at frequencies between 1 and 10 Hz (n = 14; open circles, 5 mM BAPTA, n = 3; recorded at 34 °C). The inset shows a cumulative decrease in the action potential rise rate (dV/dt)1Hz = 17,980 ms, τ2Hz = 925 ms, τ10Hz = 250 ms; n = 14). (B) Recovery from burst-induced (two or three step pulses [2 ms] from −100 mV to 0 mV) inactivation of Na+ current (black, n = 11 cell-attached patches) and Ca2+ current (blue; n = 9 [pooled cell attached, n = 4, and nucleated patches, room temperature, n = 5]). The inset shows examples of the burst-induced slow inactivation of Na+ current (black, vertical scale bar is 50 pA) and the lack of slow inactivation of the Ca2+ tail current (blue, vertical scale bar is 5 pA). I Na (black) is an overlay of multiple traces, each with an initial burst-like current followed by a single test pulse at different recovery intervals. (C) The left tracing shows a nucleated outside-out patch recording (at room temperature) comparing Na+ current in response to a single step pulse (2 ms) in control (black) or 100 ms (10 Hz) after burst conditioning (red). Arrowhead shows the lack of reduction in the I Ca (tail). The right tracing shows a reduction of the Na+ current without a change in the I Ca (tail) after bath application of 1 nM TTX (black, control; red, TTX). Values are reported as mean ± standard error of the mean.
Figure 4
Figure 4. Modest Reduction of Na+ Current Induces a Frequency-Dependent Output-Mode Transition from Bursting to Single Spiking
(A) The number of bursts in response to a train of five suprathreshold sEPSC currents injections at 2 and 5 Hz delivered every 20 sec before, during (red), and after bath application of 1 nM TTX. The black (left), red, and black (right) insets show overlays of the action potential transition in response to five 2-Hz sEPSC inputs (I Command) under baseline, TTX (1 nM), and wash conditions, respectively. Note the dashed line in the TTX (red) trace shows the lack of change in the ADP during the stimulus train. The lower panels show no change in a subthreshold sEPSP or resting potential (mV) in response to TTX. The insets show an expanded sEPSC (left; scale bar, 5 ms) and the corresponding sEPSP (right; scale bars, 1 mV vertical, and 20 ms horizontal) that was used to monitor changes in passive properties of the cell. (B) A representative trace showing the reduction in the dV/dt of the action potentials before (black) and after 1 nM TTX (red). The average reduction in the first action potential dV/dt after 1 nM TTX was 9% ± 2% (n = 5). (C) An overlay (left tracing) showing the reduction in the initial slope of the ADP before (black burst) and after (red single spike) 1 nM TTX (All traces in [A], [B], and [C] were taken from the same recording). The graph on the right shows that the low concentrations of TTX (1–5 nM) necessary to induce a switch from bursting to single spiking decrease the initial slope (as illustrated in [C]) of the ADP for a burst (black) and compared to the first transition to a single spike (red) at low frequencies (less than 0.1 Hz) that alone do not influence the burst-single spike transition (ADP reduction = 23% ± 6%, p < 0.003, n = 9).

References

    1. Sherman SM. Tonic and burst firing: Dual modes of thalamocortical relay. Trends Neurosci. 2001;24:122–126. - PubMed
    1. Sherman SM, Guillery RW. Functional organization of thalamocortical relays. J Neurophysiol. 1996;76:1367–1395. - PubMed
    1. Weyand TG, Boudreaux M, Guido W. Burst and tonic response modes in thalamic neurons during sleep and wakefulness. J Neurophysiol. 2001;85:1107–1118. - PubMed
    1. Swadlow HA, Gusev AG. Activation of a cortical column by a thalamocortical impulse. Nat Neurosci. 2001;4:402–408. - PMC - PubMed
    1. Fanselow EE, Sameshima K, Baccala LA, Nicolelis MA. Thalamic bursting in rats during different awake behavioral states. Proc Natl Acad Sci U S A. 2001;98:15330–15335. - PMC - PubMed

Publication types