. 2005 Apr 27:6:109.
doi: 10.1186/1471-2105-6-109.

Some statistical properties of regulatory DNA sequences, and their use in predicting regulatory regions in the Drosophila genome: the fluffy-tail test

Affiliations

Some statistical properties of regulatory DNA sequences, and their use in predicting regulatory regions in the Drosophila genome: the fluffy-tail test

Irina Abnizova et al. BMC Bioinformatics. .

Abstract

Background: This paper addresses the problem of recognising DNA cis-regulatory modules which are located far from genes. Experimental procedures for this are slow and costly, and computational methods are hard, because they lack positional information.

Results: We present a novel statistical method, the "fluffy-tail test", to recognise regulatory DNA. We exploit one of the basic informational properties of regulatory DNA: abundance of over-represented transcription factor binding site (TFBS) motifs, although we do not look for specific TFBS motifs, per se . Though overrepresentation of TFBS motifs in regulatory DNA has been intensively exploited by many algorithms, it is still a difficult problem to distinguish regulatory from other genomic DNA.

Conclusion: We show that, in the data used, our method is able to distinguish cis-regulatory modules by exploiting statistical differences between the probability distributions of similar words in regulatory and other DNA. The potential application of our method includes annotation of new genomic sequences and motif discovery.


Figures

Figure 1
Figure 1
Histogram of similar words for the knirps cis-regulatory module. An example of a distribution of similar 5-mer words for the knirps cis-regulatory module Drosophila melanogaster . Note that the sequence contains an exceptionally large number (37) of lists with an exceptionally large number (137) of similar words. The Y axis shows the number of lists, the X axis is for list size.
Figure 2
Figure 2
Histogram of similar words for the knirps cis-regulatory module, after shuffling. The frequency distribution of similar words for one randomly shuffled version of the knirps cis-regulatory region, Drosophila melanogaster . The Y axis shows the number of lists, the X axis is for list size.
Figure 3
Figure 3
Cumulative histograms. Cumulative histograms for the data in Figures 1 and 2: solid line: original data from Figure 1, dotted line: randomised data from Figure 2. The X axis shows the size of lists of similar words, the Y axis is the number of lists.
Figure 4
Figure 4
Fluffy-tailed knirps distribution. (Left) The distribution of the original regulatory knirps sequence: (solid line); the distribution of 10 randomised sequences (dotted lines). (Right) The same distributions in cumulative form. The X axis shows the size of lists of similar words, the Y axis is the number of lists.
Figure 5
Figure 5
Histograms for regulatory (green), coding (cyan) and NCNR (magenta) sequences. The word length is 5, mismatch is 1, r is 50. The X axis shows the fluffiness coefficient F, the Y axis is the number of sequences in the set with this F.
Figure 6
Figure 6
Separation of regulatory DNA. Separation of regulatory DNA (column 2) from coding (column 1) and non-coding, non-regulatory (column 3) due to the fluffiness coefficient F (Y-axis). Box-plot of the Fluffiness (Y-axis) index for the three functional regions.
Figure 7
Figure 7
Spatial distribution of similar words in MSW L. Fairly uniform spatial distribution of start locations for words in the MSWL (n = 137, see Fig.1) of the knirps cis- regulatory region of Drosophila melanogaster . The X axis shows the positions of each word start in the sequence, the Y axis is the rank of this position in the list.
Figure 8
Figure 8
Histogram for exon cg3201 3. Distribution of similar words for the exon cg3201 3 of Drosophil a (solid line) compared to the histograms of the randomly shuffled versions (dotted lines) in direct (left) and cumulative (right) forms. The X axis shows the size of lists of similar words, the Y axis is the number of lists.
Figure 9
Figure 9
Histogram for non-coding presumed non-regulatory sequence. Distribution of similar words for a non-coding, non-regulatory sequence, randomly picked from chromosome 3L has significant tail because of simple repeats. The X axis shows the size of lists of similar words, the Y axis is the number of lists.
Figure 10
Figure 10
Coefficient of variation in spatial cluster size for four types of DNA: exons (1), non-fluffy NCNR (2), fluffy NCNR (3), regulatory regions (4); Vertical bars denote 95% confidence intervals. The Y axis shows coefficient of variation, the X axis is for four DNA type. We calculated CV based on spatial clustering coefficient k = 1.
Figure 11
Figure 11
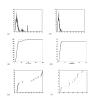
Non-coding presumed non-regulatory sequence before and after repeat-masking. For a non-coding, non-regulatory sequence, randomly picked from chromosome 3L. Panels (a,b,c) show results before repeat-masking; panels (d,e,f) show results after repeat-masking. Panels (a,d) show histograms of similar words (solid: original data; dotted: after random shuffling) as in Figure 1; panels (b,e) show the same data in cumulative form as in Figure 3; panels (c,f) show start locations of similar words as in Figure 7.

References

    1. Yuh C, Bolouri H, Davidson EH. Genomic cis-regulatory logic: functional analysis and computational model of a sea urchin gene control system. Science. 1998;279:1896–902. doi: 10.1126/science.279.5358.1896. - DOI - PubMed
    1. Yuh C, Bolouri H, Davidson EH. Cis-regulatory logic in the endo 16 gene: switching from a specification to a differentiation mode of control. Development. 2001;128:617–29. - PubMed
    1. Davidson EH. Genomic Regulatory Systems. Academic Press; 2001.
    1. Berman B, Nibu Y, Pfeiffer B, Tomancak B, Celniker S, Rubin G, Levine M, Eisen M. Exploiting TFBS clustering to identify CRM involved in pattern formation in Drosophila genome. PNAS. 2002;99:757–62. doi: 10.1073/pnas.231608898. - DOI - PMC - PubMed
    1. Wagner A. A computational genomics approach to the identification of gene networks. Nucleic Acids Research. 1997;25:3594–604. doi: 10.1093/nar/25.18.3594. - DOI - PMC - PubMed

LinkOut - more resources