

Long-term depression at olfactory nerve synapses
- PMID: 15858051
- PMCID: PMC6725109
- DOI: 10.1523/JNEUROSCI.4721-04.2005
Long-term depression at olfactory nerve synapses
Abstract
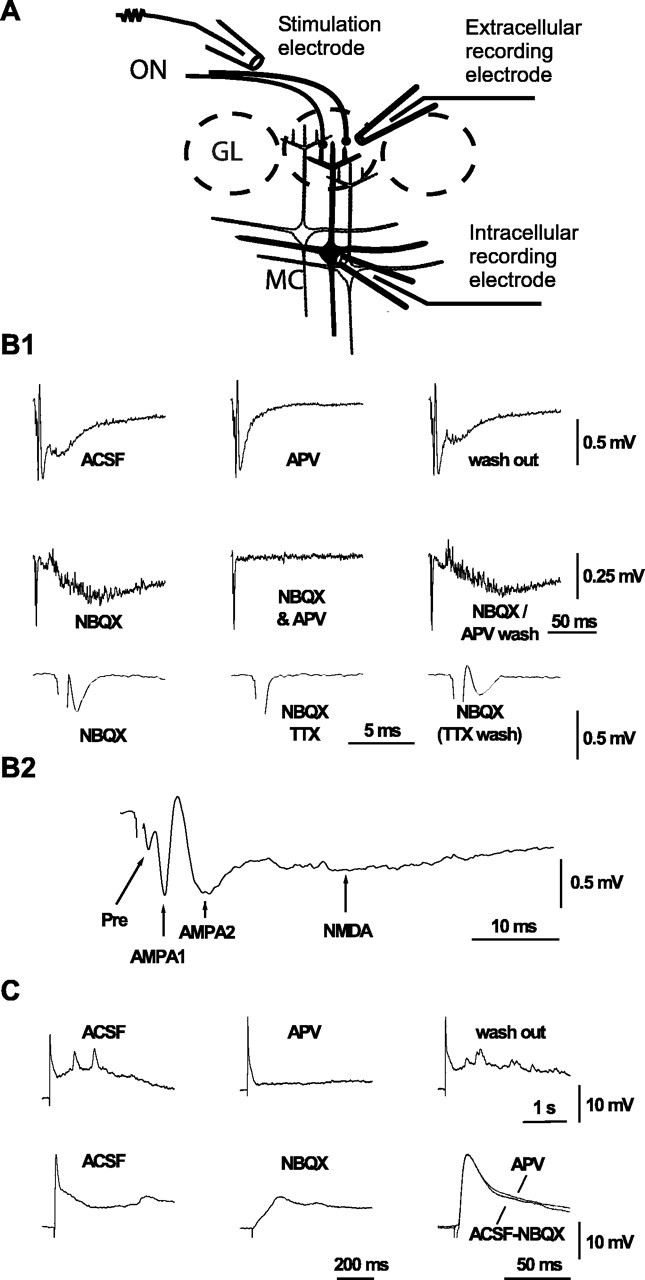
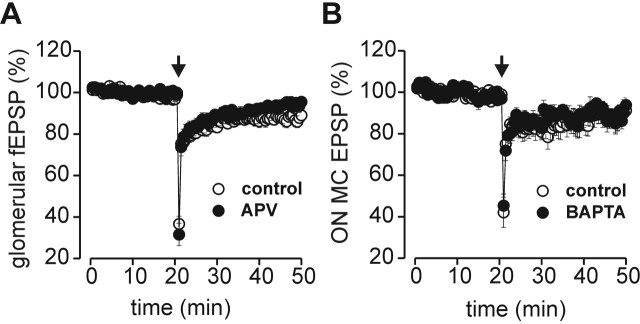
The synapses formed by the olfactory nerve (ON) convey sensory information to olfactory glomeruli, the first stage of central odor processing. Morphological and behavioral studies suggest that glomerular odor processing is plastic in neonate rodents. However, long-term synaptic plasticity, a cellular correlate of functional and structural plasticity, has not yet been demonstrated in this system. Here, we report that ON-->mitral cell (MC) synapses of 5- to 8-d-old mice express long-term depression (LTD) after brief low-frequency ON stimulation. Pharmacological techniques and imaging of presynaptic calcium signals demonstrate that ON-MC LTD is expressed presynaptically and requires the activation of metabotropic glutamate receptors but does not require fast synaptic transmission. LTD at the ON--> MC synapse is potentially relevant for the establishment, maintenance, and experience-dependent refinement of odor maps in the olfactory bulb.
Figures


Similar articles
-
A proportional but slower NMDA potentiation follows AMPA potentiation in LTP.Nat Neurosci. 2004 May;7(5):518-24. doi: 10.1038/nn1220. Epub 2004 Mar 28. Nat Neurosci. 2004. PMID: 15048122
-
Bi-directional plasticity and age-dependent long-term depression at mouse CA3-CA1 hippocampal synapses.Neurosci Lett. 2004 Aug 26;367(1):1-5. doi: 10.1016/j.neulet.2004.04.056. Neurosci Lett. 2004. PMID: 15308285
-
Effects of N-methyl-D-aspartate glutamate receptor antagonists on oscillatory signal propagation in the guinea-pig accessory olfactory bulb slice: characterization by optical, field potential and patch clamp recordings.Neuroscience. 2005;135(2):583-94. doi: 10.1016/j.neuroscience.2005.06.022. Neuroscience. 2005. PMID: 16112479
-
Olfactory nerve stimulation-evoked mGluR1 slow potentials, oscillations, and calcium signaling in mouse olfactory bulb mitral cells.J Neurophysiol. 2006 May;95(5):3097-104. doi: 10.1152/jn.00001.2006. Epub 2006 Feb 8. J Neurophysiol. 2006. PMID: 16467433
-
Dendritic sodium spikelets and low-threshold calcium spikes in turtle olfactory bulb granule cells.J Neurophysiol. 2005 Mar;93(3):1285-94. doi: 10.1152/jn.00807.2004. Epub 2004 Oct 13. J Neurophysiol. 2005. PMID: 15483062
Cited by
-
Functional maturation of the first synapse in olfaction: development and adult neurogenesis.J Neurosci. 2008 Mar 12;28(11):2919-32. doi: 10.1523/JNEUROSCI.5550-07.2008. J Neurosci. 2008. PMID: 18337423 Free PMC article.
-
Developmental regulation of metabotropic glutamate receptor 1 splice variants in olfactory bulb mitral cells.J Neurosci Res. 2009 Feb;87(2):369-79. doi: 10.1002/jnr.21864. J Neurosci Res. 2009. PMID: 18816797 Free PMC article.
-
Olfactory bulb glomerular NMDA receptors mediate olfactory nerve potentiation and odor preference learning in the neonate rat.PLoS One. 2012;7(4):e35024. doi: 10.1371/journal.pone.0035024. Epub 2012 Apr 4. PLoS One. 2012. PMID: 22496886 Free PMC article.
-
Appetitive odor learning does not change olfactory coding in a subpopulation of honeybee antennal lobe neurons.J Comp Physiol A Neuroethol Sens Neural Behav Physiol. 2006 Oct;192(10):1083-103. doi: 10.1007/s00359-006-0152-3. Epub 2006 Jul 25. J Comp Physiol A Neuroethol Sens Neural Behav Physiol. 2006. PMID: 16865372
-
Experience-dependent modification of primary sensory synapses in the mammalian olfactory bulb.J Neurosci. 2007 Aug 29;27(35):9427-38. doi: 10.1523/JNEUROSCI.0664-07.2007. J Neurosci. 2007. PMID: 17728456 Free PMC article.
References
-
- Aroniadou-Anderjaska V, Zhou FM, Priest CA, Ennis M, Shipley MT (2000) Tonic and synaptically evoked presynaptic inhibition of sensory input to the rat olfactory bulb via GABA(B) heteroreceptors. J Neurophysiol 84: 1194-1203. - PubMed
-
- Buonviso N, Chaput MA (1990) Response similarity to odors in olfactory bulb output cells presumed to be connected to the same glomerulus: eletrophysiological study using simultaneous single-unit recordings. J Neurophysiol 63: 447-454. - PubMed
-
- Chess A, Simon I, Cedar H, Axel R (1994) Allelic inactivation regulates olfactory receptor gene expression. Cell 78: 823-834. - PubMed
Publication types
MeSH terms
Substances
LinkOut - more resources
Full Text Sources
Miscellaneous