. 2005 May;7(2):206-18.
doi: 10.1016/S1525-1578(10)60547-8.

Molecular classification of renal tumors by gene expression profiling

Affiliations

Molecular classification of renal tumors by gene expression profiling

Audrey N Schuetz et al. J Mol Diagn. 2005 May.

Abstract

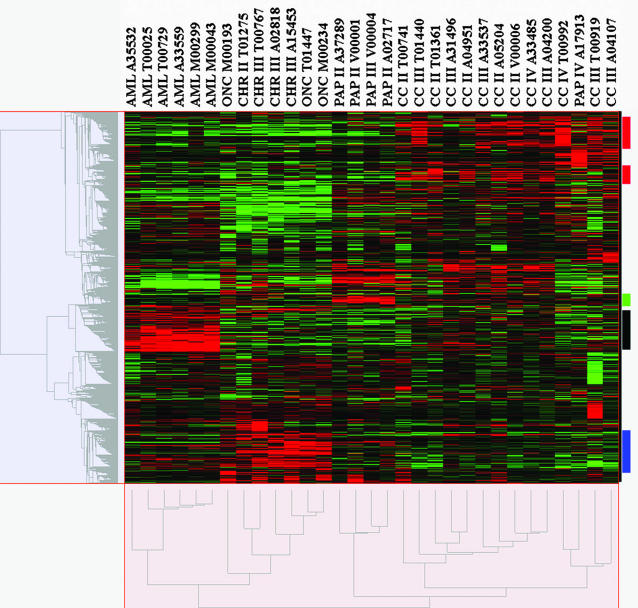
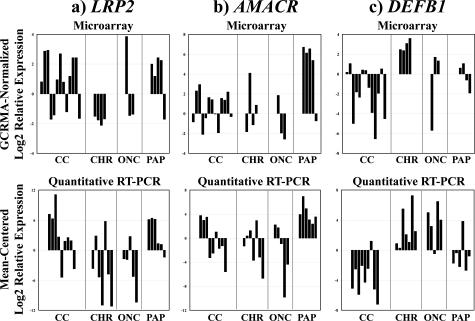
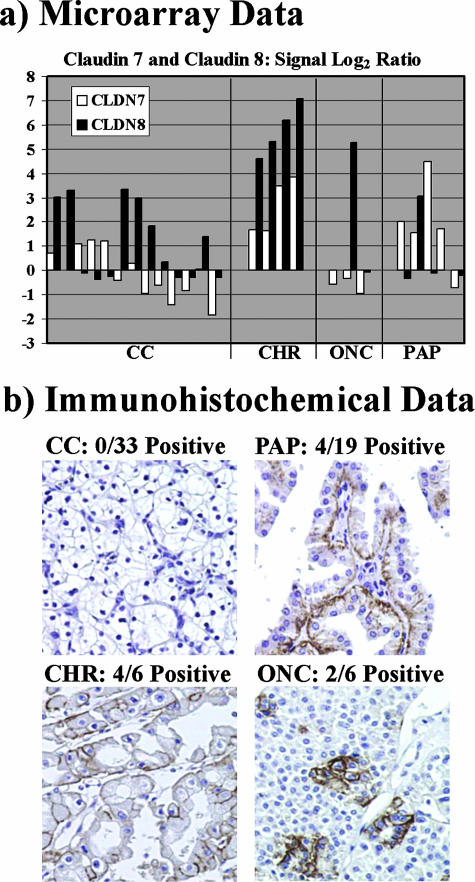
Renal tumor classification is important because histopathological subtypes are associated with distinct clinical behavior. However, diagnosis is difficult because tumor subtypes have overlapping microscopic characteristics. Therefore, ancillary methods are needed to optimize classification. We used oligonucleotide microarrays to analyze 31 adult renal tumors, including clear cell renal cell carcinoma (RCC), papillary RCC, chromophobe RCC, oncocytoma, and angiomyolipoma. Expression profiles correlated with histopathology; unsupervised algorithms clustered 30 of 31 tumors according to appropriate diagnostic subtypes while supervised analyses identified significant, subtype-specific expression markers. Clear cell RCC overexpressed proximal nephron, angiogenic, and immune response genes, chromophobe RCC oncocytoma overexpressed distal nephron and oxidative phosphorylation genes, papillary RCC overexpressed serine protease inhibitors, and extracellular matrix products, and angiomyolipoma overexpressed muscle developmental, lipid biosynthetic, melanocytic, and distinct angiogenic factors. Quantitative reverse transcriptase-polymerase chain reaction and immunohistochemistry of formalin-fixed renal tumors confirmed overexpression of proximal nephron markers (megalin/low-density lipoprotein-related protein 2, alpha-methylacyl CoA racemase) in clear cell and papillary RCC and distal nephron markers (beta-defensin 1, claudin 7) in chromophobe RCC/oncocytoma. In summary, renal tumor subtypes were classified by distinct gene expression profiles, illustrating tumor pathobiology and translating into novel molecular bioassays using fixed tissue.


Figures

Figure 1
Figure 1
Unsupervised hierarchical clustering of 31 renal neoplasms. Similarity measurements are based on Pearson correlation. Median-centered differential gene expression is shown in the color-coded grid, with columns representing individual tumors and rows representing individual genes. Red, green, and black grid blocks indicate expression above, below, and at the median of all tumors, respectively. Based on profiles of 4030 differentially expressed genes, tumors were clustered into subgroups corresponding to clear cell RCC, papillary RCC, chromophobe RCC/renal oncocytoma, and angiomyolipoma. The sole outlier (PAP IV A17913) was a high-grade papillary RCC with sarcomatoid transformation, which was clustered with clear cell RCC. The same tumor classification was obtained when all 8746 genes on the microarray were analyzed (data not shown). Red, green, black, and blue bars to the right of the color-coded grid indicate genes overexpressed in clear cell RCC, papillary RCC, angiomyolipoma, and chromophobe RCC/oncocytoma, respectively. Tumor names above the grid are interpreted as follows: CC, clear cell RCC; PAP, papillary RCC; CHR, chromophobe RCC; ONC, renal oncocytoma; AML, angiomyolipoma. Roman numerals indicate Fuhrman nuclear grade. Identification codes with one letter followed by five digits are for internal tracking only. Of the carcinomas in this analysis, only one case (CC IV T00992) was documented to be metastatic.
Figure 2
Figure 2
Differential expression of proximal and distal nephron markers in renal epithelial neoplasms: validation of microarray data by quantitative RT-PCR. Graphs at the top of the figure show normalized log2 gene expression ratios in tumor RNA relative to reference RNA, determined by oligonucleotide microarray. Graphs at the bottom of the figure show mean-centered log2 gene expression ratios in tumor RNA relative to reference RNA, determined by quantitative RT-PCR. In all graphs, bars indicate relative gene expression in individual tumors. Tumor subtypes are indicated below the x axes: CC, clear cell RCC; PAP, papillary RCC; CHR, chromophobe RCC; ONC, renal oncocytoma. a: Megalin/low-density lipoprotein-related protein 2 (LRP2, left). The proximal nephron marker LRP2 was typically expressed at high levels in clear cell and papillary RCC, although the confirmatory data did not reach statistical significance (P = 0.30 by quantitative RT-PCR). b: α-Methylacyl CoA racemase (AMACR, center). The proximal nephron marker AMACR was overexpressed significantly in papillary RCC (P = 0.0047 by quantitative RT-PCR). c: β-Defensin 1 (DEFB1, right). The distal nephron marker DEFB1 was overexpressed significantly in chromophobe RCC and oncocytoma (P = 0.024 by quantitative RT-PCR).
Figure 3
Figure 3
Expression of distal nephron claudins in renal epithelial neoplasms. a: Microarray data. Graph shows normalized log2 gene expression ratios in tumor RNA relative to reference RNA. White bars, claudin 7 (CLDN7); black bars, claudin 8 (CLDN8). Bars indicate relative gene expression in individual tumors. Tumor subtypes are indicated below the x axis: CC, clear cell RCC; PAP, papillary RCC; CHR, chromophobe RCC; ONC, renal oncocytoma. CLDN7 and CLDN8 were overexpressed in chromophobe RCC relative to oncocytoma. b: Immunohistochemical data. CLDN7 gene product was detected by immunoperoxidase reactions, using diaminobenzidine (brown) as the chromogenic peroxidase substrate and hematoxylin (blue) as the nuclear counterstain. Representative images are shown for each renal tumor subtype, with tumor subtype and frequency of positive reactions indicated above each panel. CLDN7 gene product was detected in 4 of 6 chromophobe RCCs, 2 of 6 oncocytomas, 4 of 19 papillary RCCs, and 0 of 33 clear cell RCCs. In chromophobe RCC and oncocytoma, the immunohistochemical staining pattern was membranous in tumor cells. In papillary RCC, the predominant staining pattern was cytoplasmic in stromal cells. Original magnifications, ×100.

References

    1. Jemal A, Tiwari RC, Murray T, Ghafoor A, Samuels A, Ward E, Feuer EJ, Thun MJ. Cancer Statistics, 2004. CA Cancer J Clin. 2004;54:8–29. - PubMed
    1. Homma Y, Kawabe K, Kitamura T, Nishimura Y, Shinohara M, Kondo Y, Saito I, Minowada S, Asakage Y. Increased incidental detection and reduced mortality in renal cancer—recent retrospective analysis at eight institutions. Int J Urol. 1995;2:77–80. - PubMed
    1. Amin MaB, Amin MiB, Tamboli P, Javidan J, Stricker H, de-Peralta Venturina M, Deshpande A, Menon M. Prognostic impact of histologic subtyping of adult renal epithelial neoplasms: an experience of 405 cases. Am J Surg Pathol. 2002;26:281–291. - PubMed
    1. Zisman A, Pantuck AJ, Wieder J, Chao DH, Dorey F, Said JW, deKernion JB, Figlin RA, Belldegrun AS. Risk group assessment and clinical outcome algorithm to predict the natural history of patients with surgically resected renal cell carcinoma. J Clin Oncol. 2002;20:4559–4566. - PubMed
    1. Gieseg MA, Cody T, Man MZ, Madore SJ, Rubin MA, Kaldjian EP. Expression profiling of human renal carcinomas with functional taxonomic analysis. BMC Bioinformatics. 2002;3:26. - PMC - PubMed

Publication types

MeSH terms