

Dynamics of Drosophila embryonic patterning network perturbed in space and time using microfluidics
- PMID: 15858575
- PMCID: PMC2656922
- DOI: 10.1038/nature03509
Dynamics of Drosophila embryonic patterning network perturbed in space and time using microfluidics
Abstract
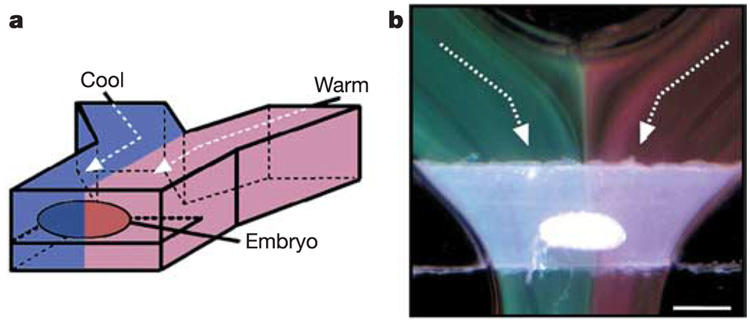
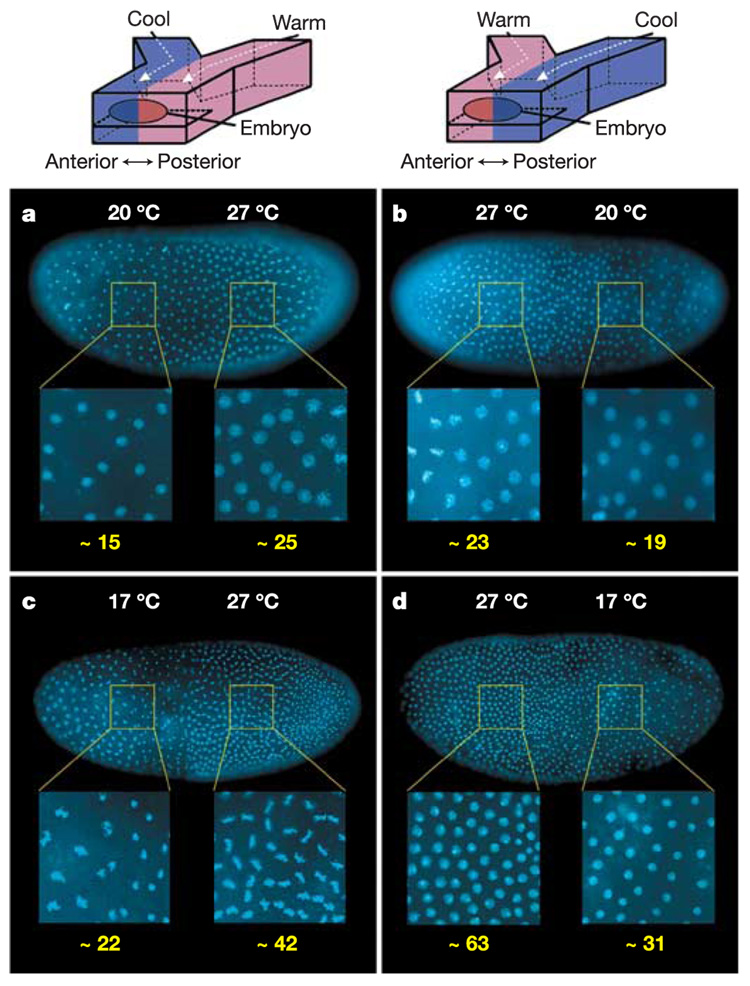
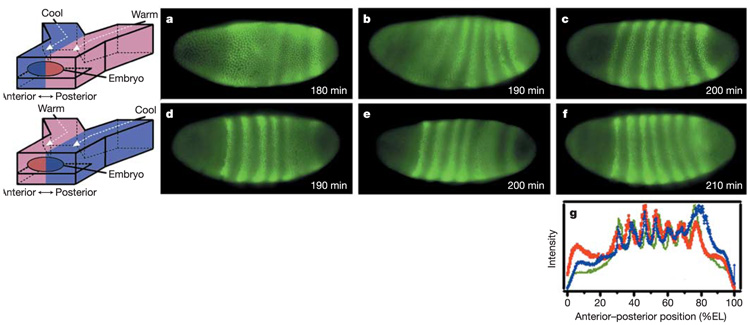
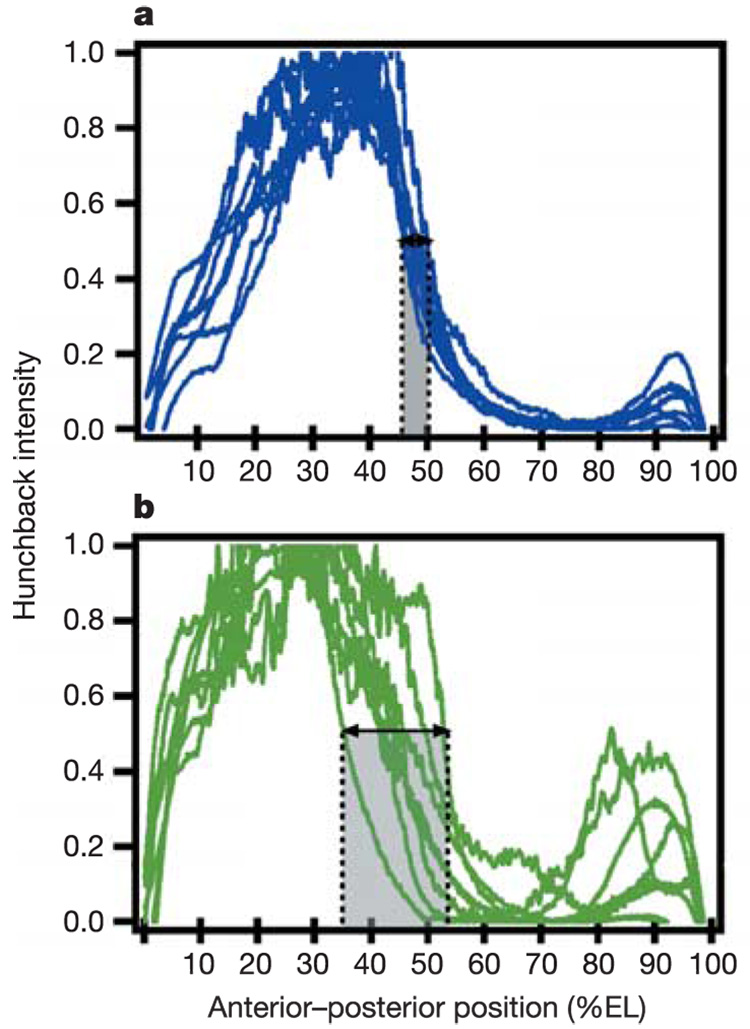
Biochemical networks are perturbed both by fluctuations in environmental conditions and genetic variation. These perturbations must be compensated for, especially when they occur during embryonic pattern formation. Complex chemical reaction networks displaying spatiotemporal dynamics have been controlled and understood by perturbing their environment in space and time. Here, we apply this approach using microfluidics to investigate the robust network in Drosophila melanogaster that compensates for variation in the Bicoid morphogen gradient. We show that the compensation system can counteract the effects of extremely unnatural environmental conditions--a temperature step--in which the anterior and posterior halves of the embryo are developing at different temperatures and thus at different rates. Embryonic patterning was normal under this condition, suggesting that a simple reciprocal gradient system is not the mechanism of compensation. Time-specific reversals of the temperature step narrowed down the critical period for compensation to between 65 and 100 min after onset of embryonic development. The microfluidic technology used here may prove useful to future studies, as it allows spatial and temporal regulation of embryonic development.
Figures
References
-
- Wolff J, et al. Spatiotemporal addressing of surface activity. Science. 2001;294:134–137. - PubMed
-
- Sakurai T, Mihaliuk E, Chirila F, Showalter K. Design and control of wave propagation patterns in excitable media. Science. 2002;296:2009–2012. - PubMed
-
- Vanag VK, et al. Oscillatory cluster patterns in a homogeneous chemical system with global feedback. Nature. 2000;406:389–391. - PubMed
-
- Driever W, Nusslein Volhard C. The Bicoid protein determines position in the Drosophila embryo in a concentration-dependent manner. Cell. 1988;54:95–104. - PubMed
-
- Houchmandzadeh B, Wieschaus E, Leibler S. Establishment of developmental precision and proportions in the early Drosophila embryo. Nature. 2002;415:798–802. - PubMed
Publication types
MeSH terms
Substances
Grants and funding
LinkOut - more resources
Full Text Sources
Other Literature Sources
Molecular Biology Databases
