

Antipsychotic drugs elevate mRNA levels of presynaptic proteins in the frontal cortex of the rat
- PMID: 15860345
- PMCID: PMC2734482
- DOI: 10.1016/j.biopsych.2005.01.022
Antipsychotic drugs elevate mRNA levels of presynaptic proteins in the frontal cortex of the rat
Abstract
Background: Molecular adaptations are believed to contribute to the mechanism of action of antipsychotic drugs (APDs). We attempted to establish common gene regulation patterns induced by chronic treatment with APDs.
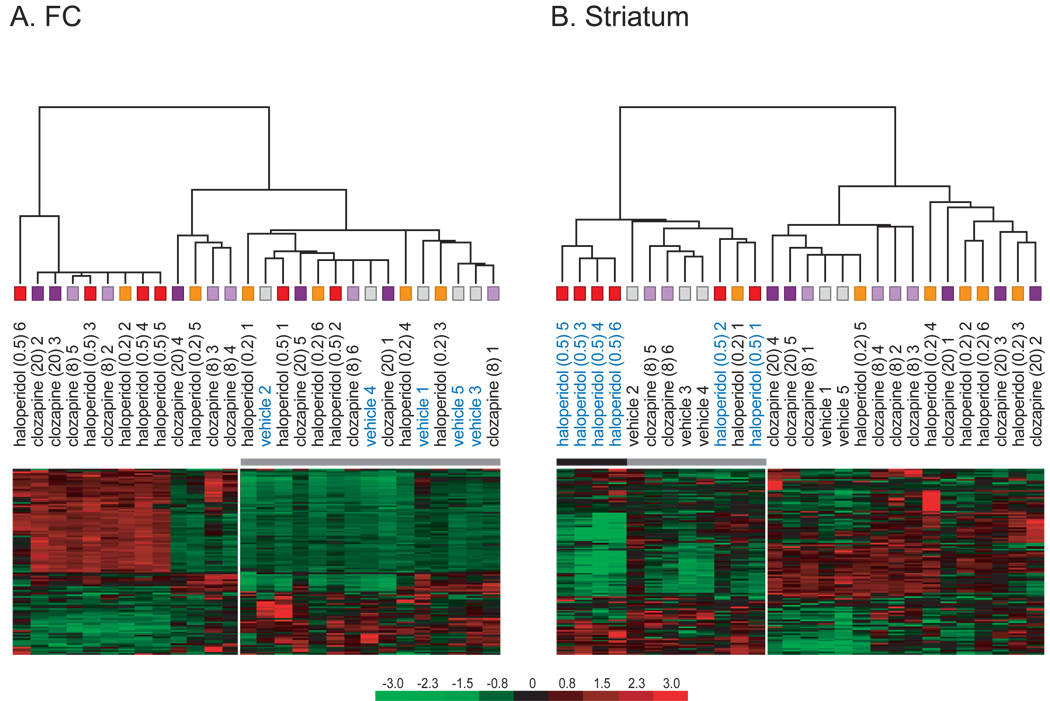
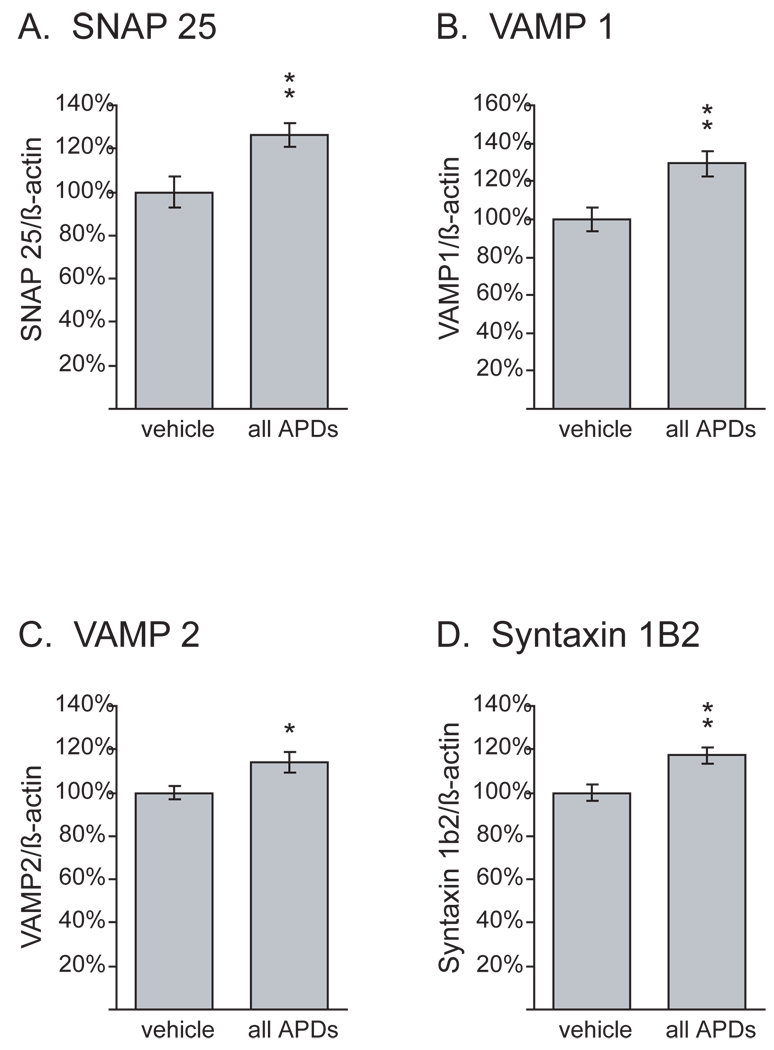
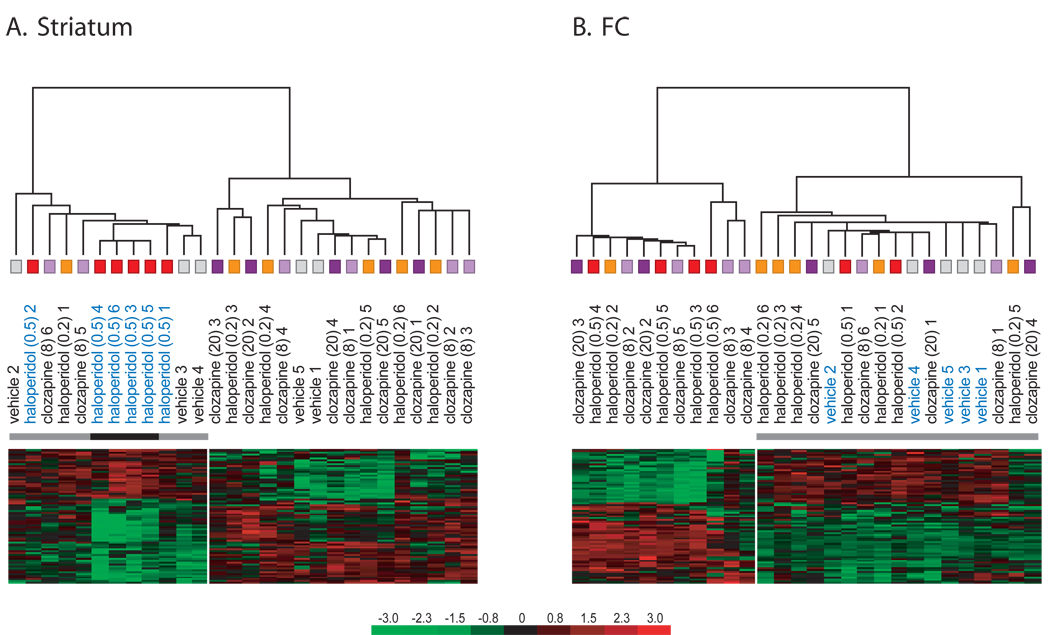
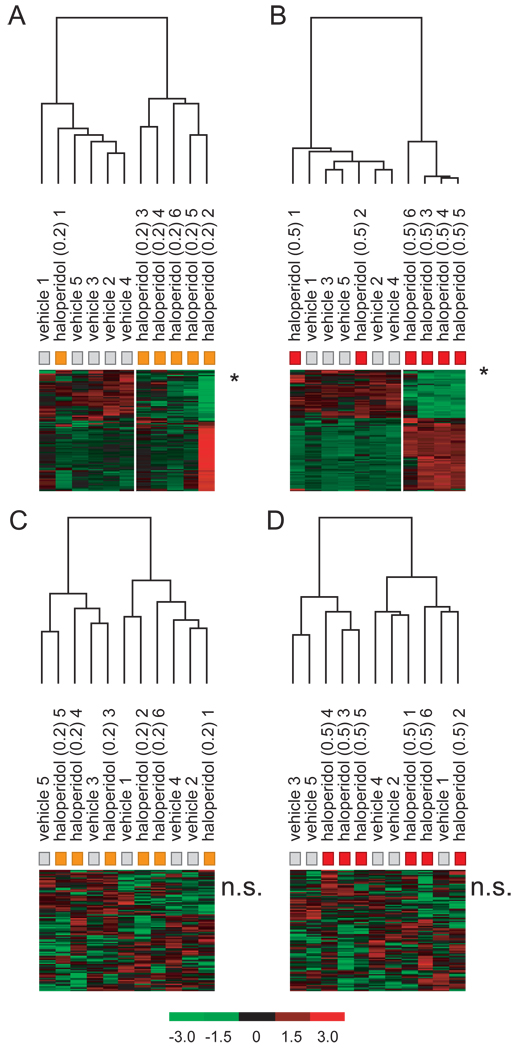
Methods: Gene expression analysis was performed with the Affymetrix U34A array in the frontal cortex (FC) and the striatum of rats chronically treated with two concentrations of either clozapine or haloperidol. Key data were verified with real-time quantitative polymerase chain reaction.
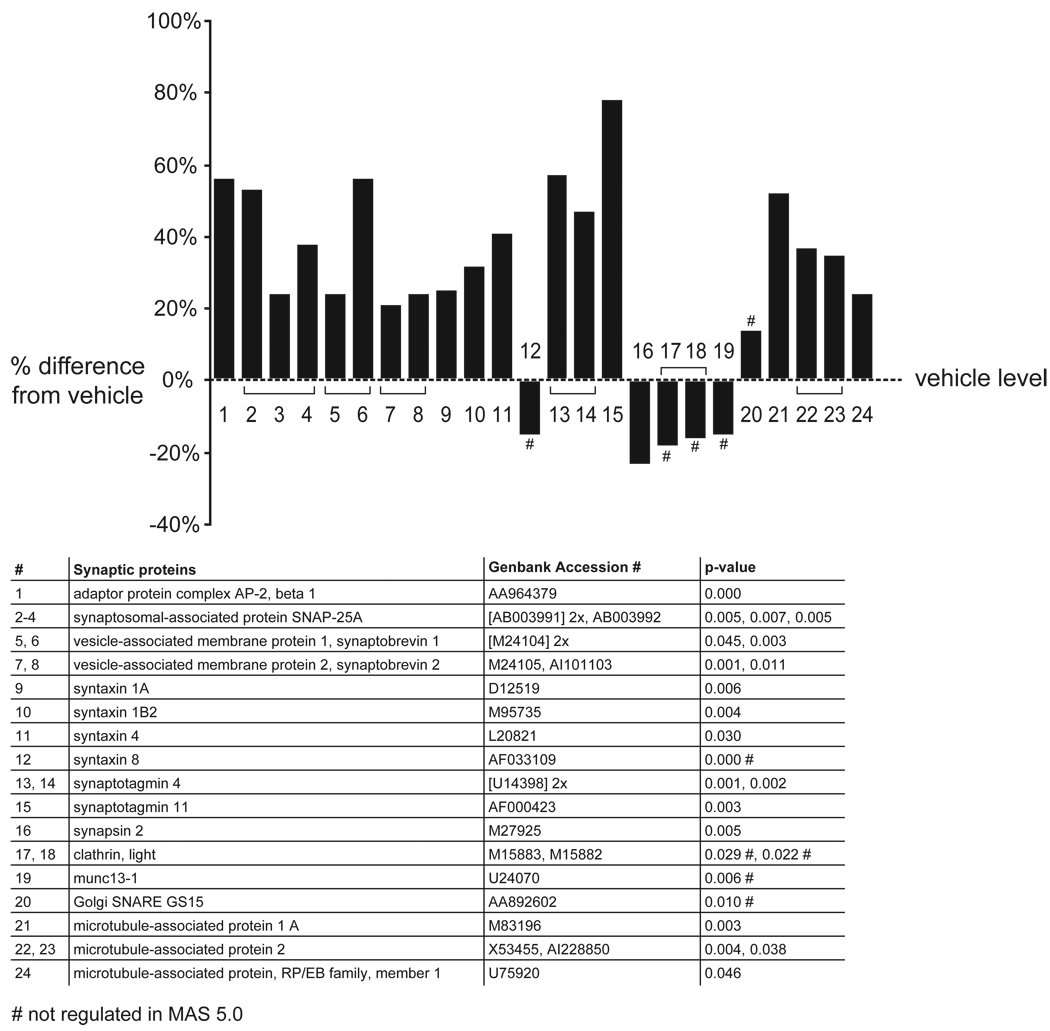
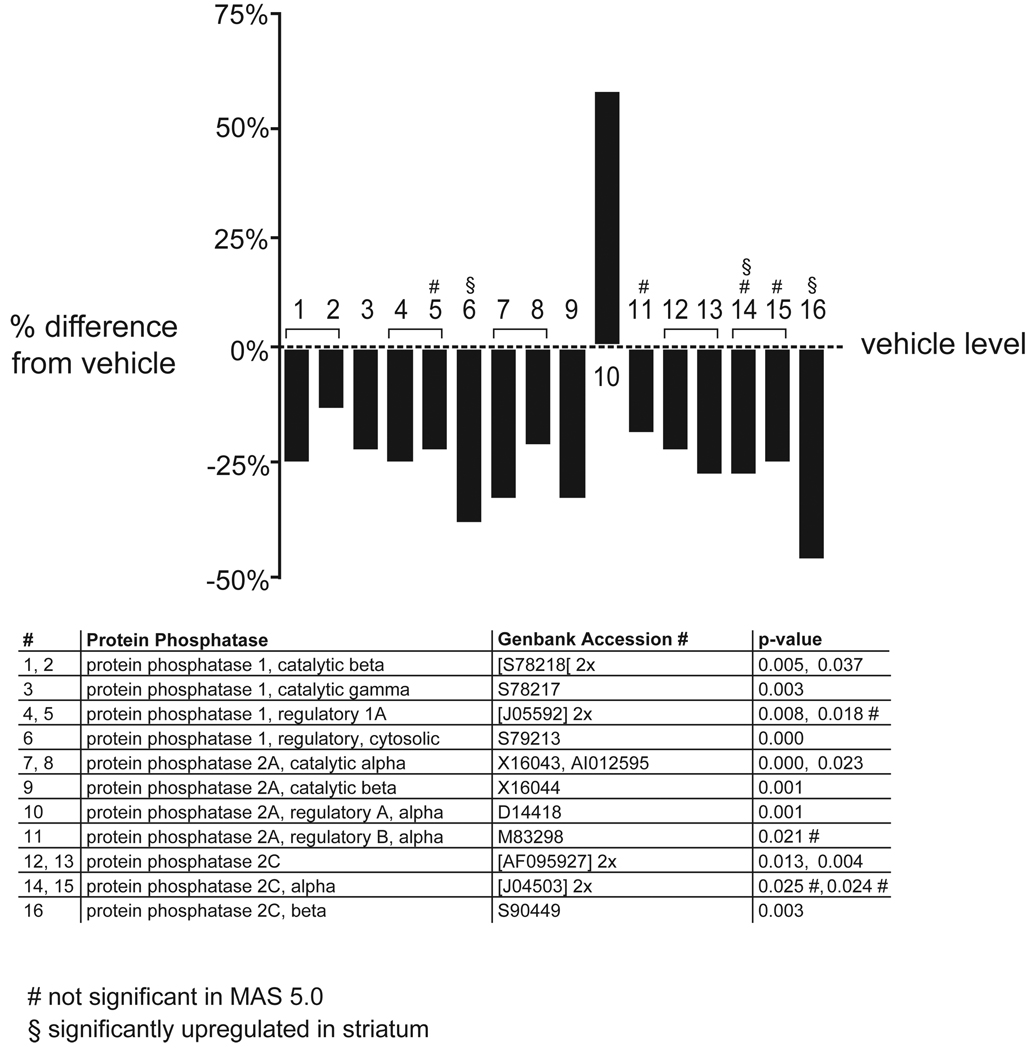
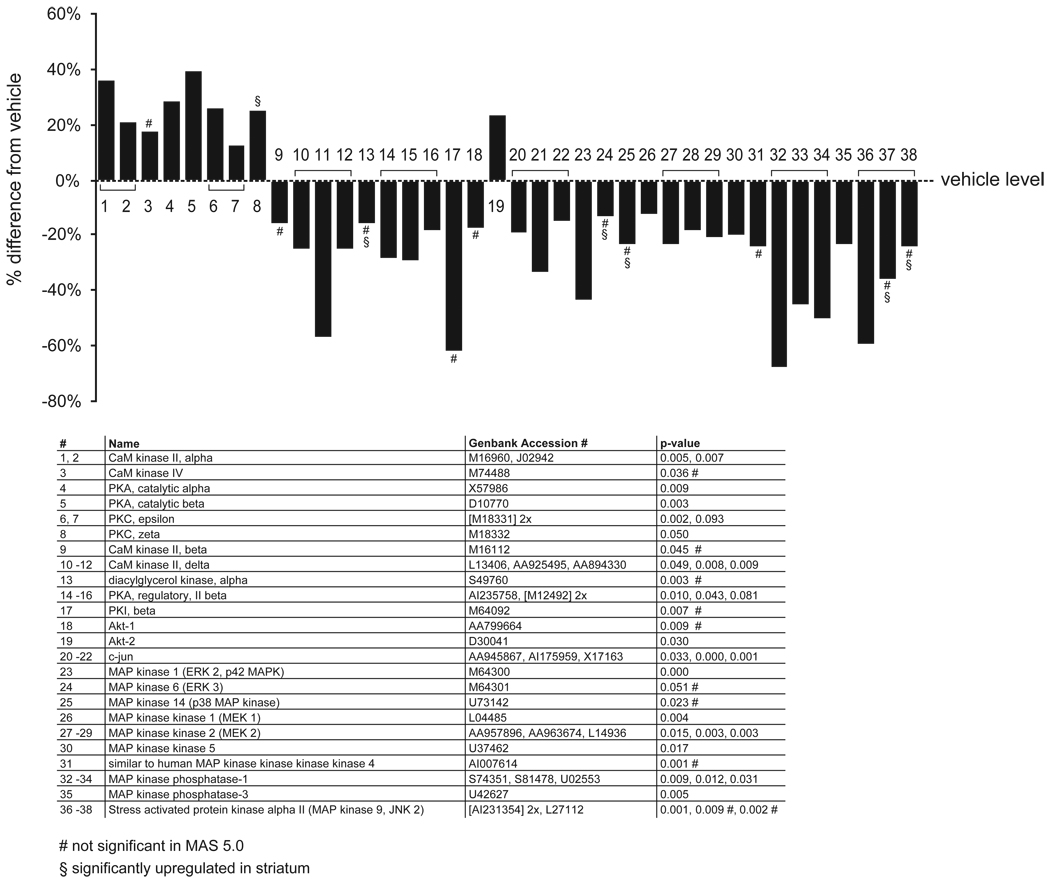
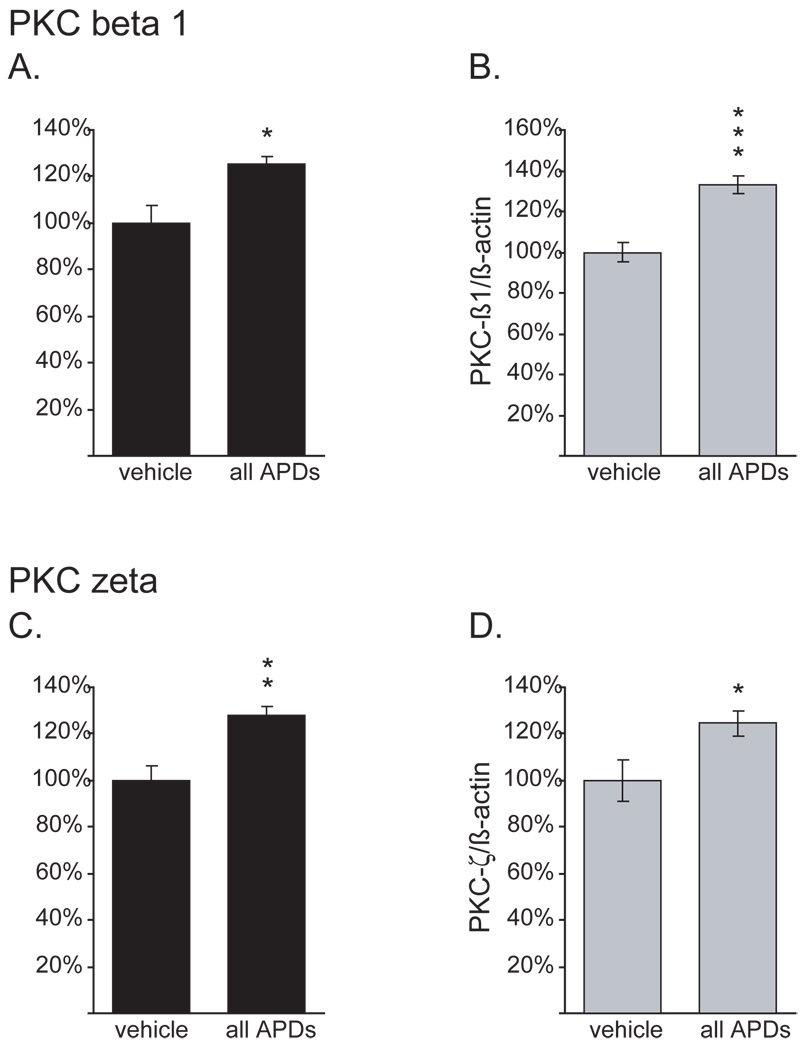
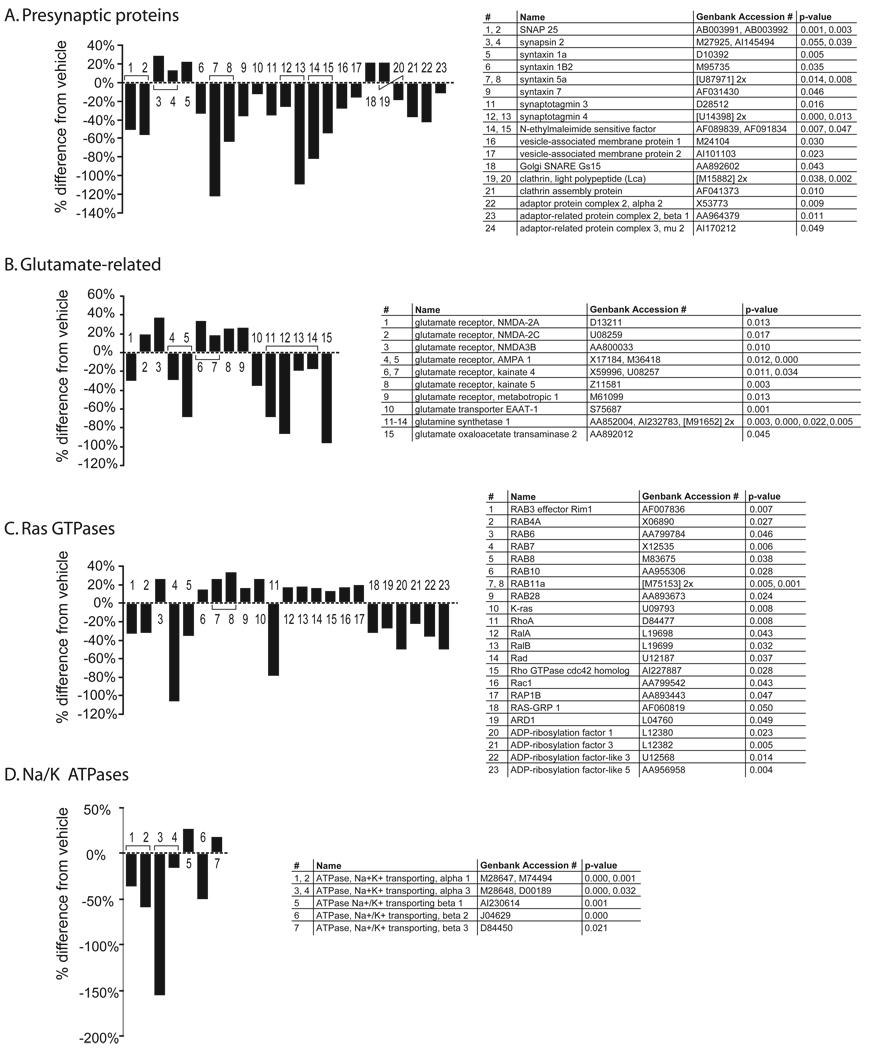
Results: Many genes in the FC affected by APD-treatment contribute to similar functions. mRNAs coding for synaptic vesicle docking- and microtubule-associated proteins were upregulated; mRNAs for serine-threonine protein phosphatases were downregulated, whereas the serine-threonine kinases protein kinase A, protein kinase C, and calcium/calmodulin kinase II alpha and IV were upregulated, indicating increased potential for protein phosphorylation. In the striatum, altered gene expression was less focused on genes of particular function or location, and the high concentration of haloperidol had a different gene expression profile than any of the other APD treatments.
Conclusion: We found an increase in the transcription of genes coding for proteins involved in synaptic plasticity and synaptic activity in the FC. We furthermore found that the gene expression profile of APDs is different between FC and striatum.
Figures
Similar articles
-
Comparative gene expression study of the chronic exposure to clozapine and haloperidol in rat frontal cortex.Schizophr Res. 2012 Feb;134(2-3):211-8. doi: 10.1016/j.schres.2011.11.013. Epub 2011 Dec 10. Schizophr Res. 2012. PMID: 22154595
-
Differential effects of clozapine and haloperidol on dopamine receptor mRNA expression in rat striatum and cortex.Brain Res Mol Brain Res. 1996 Sep 5;41(1-2):241-9. doi: 10.1016/0169-328x(96)00101-5. Brain Res Mol Brain Res. 1996. PMID: 8883957
-
Selective regulation of presynaptic calcium/calmodulin-dependent protein kinase II by psychotropic drugs.Biol Psychiatry. 2003 Mar 1;53(5):442-9. doi: 10.1016/s0006-3223(02)01491-9. Biol Psychiatry. 2003. PMID: 12614997
-
Chronic antipsychotics treatment regulates MAOA, MAOB and COMT gene expression in rat frontal cortex.J Psychiatr Res. 2007 Jan-Feb;41(1-2):57-62. doi: 10.1016/j.jpsychires.2005.03.005. Epub 2005 Jun 17. J Psychiatr Res. 2007. PMID: 15964593
-
Microarray analysis of genes expressed in the frontal cortex of rats chronically treated with morphine and after naloxone precipitated withdrawal.Brain Res Mol Brain Res. 2003 Apr 10;112(1-2):113-25. doi: 10.1016/s0169-328x(03)00057-3. Brain Res Mol Brain Res. 2003. PMID: 12670709
Cited by
-
A novel mechanism and treatment target for presynaptic abnormalities in specific striatal regions in schizophrenia.Neuropsychopharmacology. 2010 Apr;35(5):1226-38. doi: 10.1038/npp.2009.228. Epub 2010 Jan 13. Neuropsychopharmacology. 2010. PMID: 20072114 Free PMC article.
-
AMPA receptor subunit and splice variant expression in the DLPFC of schizophrenic subjects and rhesus monkeys chronically administered antipsychotic drugs.Schizophr Res. 2007 Feb;90(1-3):28-40. doi: 10.1016/j.schres.2006.10.004. Epub 2006 Dec 1. Schizophr Res. 2007. PMID: 17141476 Free PMC article.
-
Desipramine reduces stress-activated dynorphin expression and CREB phosphorylation in NAc tissue.Mol Pharmacol. 2009 Mar;75(3):704-12. doi: 10.1124/mol.108.051417. Epub 2008 Dec 23. Mol Pharmacol. 2009. PMID: 19106229 Free PMC article.
-
Chronic neuroleptic treatment reduces endogenous kynurenic acid levels in rat brain.J Neural Transm (Vienna). 2006 Oct;113(10):1355-65. doi: 10.1007/s00702-005-0432-z. Epub 2006 Feb 9. J Neural Transm (Vienna). 2006. PMID: 16465454
-
Electroconvulsive Seizures Induce Autophagy by Activating the AMPK Signaling Pathway in the Rat Frontal Cortex.Int J Neuropsychopharmacol. 2020 Mar 10;23(1):42-52. doi: 10.1093/ijnp/pyz055. Int J Neuropsychopharmacol. 2020. PMID: 31678999 Free PMC article.
References
-
- Agell N, Bachs O, Rocamora N, Villalonga P. Modulation of the Ras/Raf/MEK/ERK pathway by Ca(2+), and calmodulin. Cell Signal. 2002;14:649–654. - PubMed
-
- Andreasen NC. Symptoms, signs, and diagnosis of schizophrenia. Lancet. 1995;346:477–481. - PubMed
-
- Andreassen OA, Jorgensen HA. Neurotoxicity associated with neuroleptic-induced oral dyskinesias in rats Implications for tardive dyskinesia? Prog Neurobiol. 2000;61:525–541. - PubMed
-
- Aymard N, Baldacci C, Leyris A, Smagghe PO, Tribolet S, Vacheron MN, Viala A, Caroli F. Neuroleptic-resistant schizophrenic patients treated by clozapine: clinical evolution, plasma and red blood cell clozapine and desmethylclozapine levels. Therapie. 1997;52:227–232. - PubMed
-
- Bolstad BM, Irizarry RA, Astrand M, Speed TP. A comparison of normalization methods for high density oligonucleotide array data based on variance and bias. Bioinformatics. 2003;19:185–193. - PubMed
Publication types
MeSH terms
Substances
Grants and funding
LinkOut - more resources
Full Text Sources
Other Literature Sources
