Clinical Trial
. 2005 Jul 1;566(Pt 1):257-71.
doi: 10.1113/jphysiol.2005.087817. Epub 2005 Apr 28.

Increase in group II excitation from ankle muscles to thigh motoneurones during human standing

Affiliations
Clinical Trial

Increase in group II excitation from ankle muscles to thigh motoneurones during human standing

Véronique Marchand-Pauvert et al. J Physiol. .

Abstract

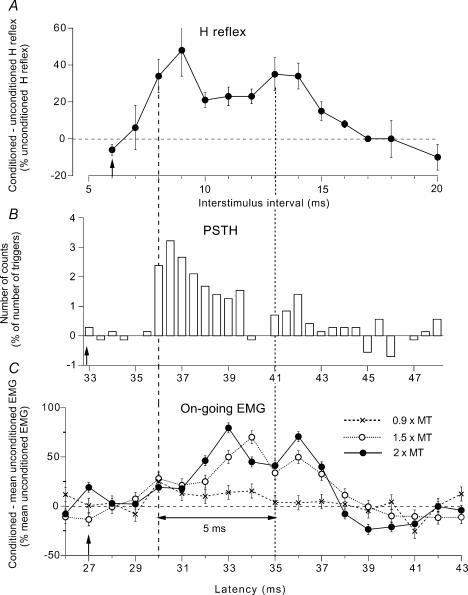
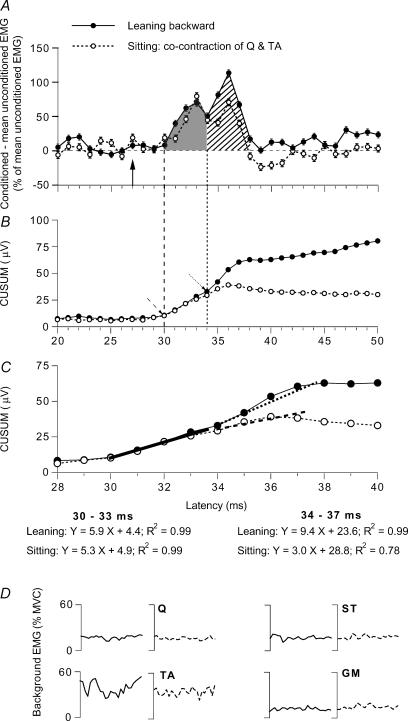
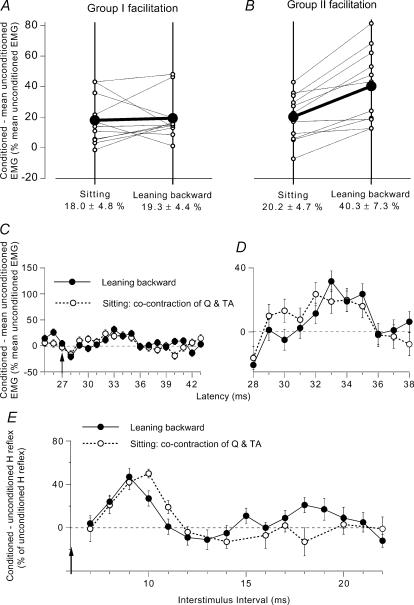
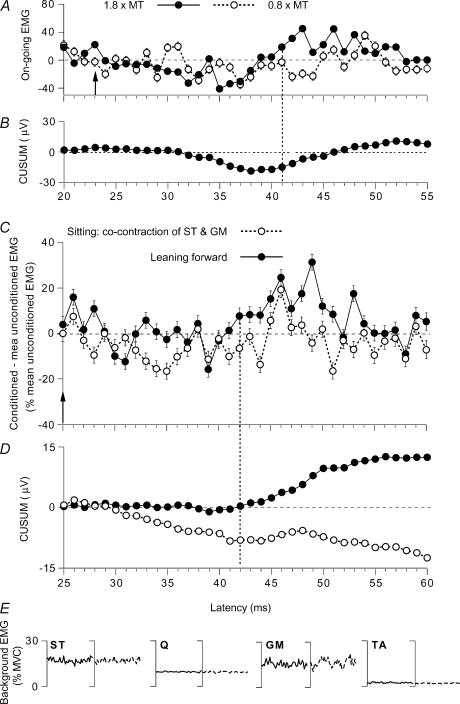
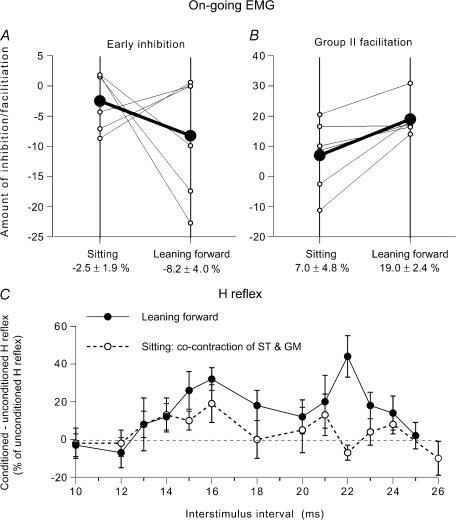
In standing subjects, we investigated the excitation of quadriceps (Q) motoneurones by muscle afferents from tibialis anterior (TA) and the excitation of semitendinosus (ST) motoneurones by muscle afferents from gastrocnemius medialis (GM). Standing with a backward lean stretches the anterior muscle pair (TA and Q) and they must be co-contracted to maintain balance. Equally, forward lean stretches the posterior muscle pair (GM and ST) and they must be co-contracted. We used these conditions of enhanced lean to increase the influence of gamma static motoneurones on muscle spindle afferents, which enhances the background input from these afferents to extrafusal motoneurones. The effects of the conditioning volleys on motoneurone excitability was estimated using the modulation of the on-going rectified EMG and of the H reflex. Stimulation of afferents from TA in the deep peroneal nerve at 1.5-2 x MT (motor threshold) evoked early group I and late group II excitation of Q motoneurones. Stimulation of afferents in the GM nerve at 1.3-1.8 MT evoked only late group II excitation of ST motoneurones. The late excitation produced by the group II afferents was significantly greater when subjects were standing and leaning than when they voluntarily co-contracted the same muscle pairs at the same levels of activation. The early effect produced by the group I afferents was unchanged. We propose that this increase in excitation by group II afferents reflects a posture-related withdrawal of a tonic inhibition that is exerted by descending noradrenergic control and is specific to the synaptic actions of group II afferents.


Figures

Figure 1
Figure 1. Three measures of modulation of responses of quadriceps (Q) motoneurones following stimulation of the deep peroneal (DP) nerve
A–C, changes produced in the same subject (same experiment) by DP stimulation (at 1.5 × MT, A, B and C○) during a weak (∼3% of MVC) tonic Q voluntary contraction in the sitting position. A, difference between conditioned and unconditioned H reflexes (expressed as a percentage of unconditioned H reflexes) plotted against the conditioning-test (interstimulus) interval between DP and femoral nerve (FN) stimuli (unconditioned H reflex set at 18% of Mmax). Each symbol represents the mean (± s.e.m.) of 20 responses. B, changes in firing probability of a single motor unit (after subtraction of the background firing, 0.5 ms bin width), with the number of counts expressed as a percentage of the number of triggers, plotted against the latency after DP stimulation. C, changes in the rectified and averaged (mean ± s.e.m. of 150 sweeps) on-going EMG (difference between conditioned and mean unconditioned EMG expressed as a percentage of the mean unconditioned EMG) plotted against the latency after DP stimulation. Results obtained with stimulation at 2 (•) and 0.9 (×) × MT are also shown. Vertical dashed and dotted lines, estimates of the beginning of the early and late facilitation, respectively, separated by 5 ms (double-headed horizontal arrow). Distances from stimulation sites to the spinal cord (L2 vertebra) were 0.70 m (DP) and 0.25 m (FN). At conduction velocities of 67 and 58 ms−1 for DP and FN Ia volleys, respectively, the resulting difference in afferent conduction times for the fastest Ia volleys in the two nerves was 6.1 ms ([0.70/68 = 10.4 ms]–[0.25/58 = 4.3 ms]). Latencies of the Q H reflex 21 ms, and of the homonymous monosynaptic Ia peak in the PSTH 27 ms (because of the trigger delay of the unit, 6 ms). Expected time of arrival of the DP Ia volley at motoneurone level (0 central delay, vertical arrows) 33 ms (27 + 6.1) in the PSTH (B), 27 ms (21 + 6.1) in the on-going EMG (C), and corresponding to the 6 ms interstimulus interval for the H reflex (A).
Figure 2
Figure 2. Modulation of the on-going Q EMG while leaning backward and while sitting
Data for one of the subjects. A–C, changes in the rectified and averaged on-going Q (VC) EMG (A) and corresponding CUSUMs (B and C) after DP stimulation (2 × MT) while leaning backward (•) and during tonic voluntary cocontraction of TA and Q in sitting (○; same subject as in Fig. 1, but stronger Q contraction at 20% of MVC). A, difference between conditioned and mean unconditioned EMG, expressed as a percentage of the mean unconditioned EMG (mean ± s.e.m. of 100 sweeps) plotted against the latency after DP stimulation, with early (grey area) and late (hatched area) excitation. B and C, CUSUMs (in µV, because they were calculated from the raw data without amplification) of the data illustrated in A. B, CUSUM with the same abscissa as in A, i.e. the first bins of the CUSUM (starting 13 ms after DP stimulation, see Methods) are not shown. Dashed and dotted oblique arrow, onset of early and late facilitation, respectively. C, same data as in B with an expanded scale for the abscissa. Linear regressions have been drawn between 30 and 33 ms (thick continuous line) and 34 and 37 ms (dotted line, leaning backward; dashed line, cocontraction in sitting position): the resulting models of the regressions and the coefficients are shown beneath panel C in the two situations (‘leaning’ and ‘sitting’). Vertical arrow (A, 27 ms) and vertical dashed and dotted lines (A and B) as in Fig. 1. D, background rectified and averaged (100 sweeps) on-going EMG in Q, ST, TA and GM (as a percentage of MVC, 25–50 ms after DP stimulation) recorded during the same experiment while leaning backward (continuous lines) and during sitting on a high stool (dotted lines).
Figure 3
Figure 3. Modulation of the on-going Q EMG (group data) and of the Q H reflex while leaning backward and while sitting
A and B, group data (11 subjects) on the modulation of the on-going Q EMG by DP stimuli at 2 × MT. Each thin line (and ○) represents one subject and the thick lines (and •) the mean values for the group. The data have been obtained when the subjects were leaning backward (right vertical line) and during voluntary cocontraction (left vertical line), at matched levels of EMG activity. Early group I (A) and late group II (B) facilitation of the Q on-going EMG (difference between conditioned and unconditioned EMG, expressed as a percentage of baseline unconditioned EMG) are calculated within windows corresponding to dotted and hatched areas in Fig. 2A, respectively. Mean (±1 s.e.m.) values in the group are shown beneath each corresponding vertical line. C and D, effects of a weak (0.9 × MT) DP stimulation on the on-going Q EMG (mean ± 1 s.e.m. of 100 sweeps, same subject as in Fig. 1). Difference between conditioned and baseline unconditioned EMG, expressed as a percentage of baseline unconditioned EMG, plotted against the latency after DP stimulation while leaning backward (•) and during tonic voluntary cocontraction of TA and Q while sitting (○). C, same ordinate as in Fig. 2A; vertical arrow as in Fig. 1. D, same data as in C but with expanded scale for the two axes. E, changes in the Q H reflex produced by DP stimulation (2 × MT; difference between conditioned and unconditioned H reflexes, expressed as a percentage of unconditioned H reflexes (set at 25–30% of Mmax)), plotted against the DP–FN interstimulus interval. Results are compared (at matched level of EMG activity, ∼20% of MVC in Q) while leaning backward (•) and during a strong tonic voluntary cocontraction of TA and Q while sitting on a high stool (○). Each symbol represents the mean (± s.e.m.) of 20 responses (same subject as in Figs 1 and 2).
Figure 4
Figure 4. Modulation of the on-going semitendinosus (ST) EMG while leaning forward and while sitting
Data for individual subjects. A–D, changes in the rectified and averaged on-going ST EMG (A and C, difference between conditioned and mean unconditioned EMG, expressed as a percentage of the mean unconditioned EMG, mean ± s.e.m. of 100 sweeps) and corresponding CUSUMs (B and D, raw data without amplification, in µV) after GM stimulation. A and B and C–E, data from two different subjects. A, effects of GM stimulation set at 1.8 (•) and 0.8 (○) × MT during tonic voluntary contraction (14% of MVC) in sitting position. B, CUSUM of the data illustrated in A after stimulation at 1.8 × MT. C, modulation of the on-going ST EMG by a GM stimulation at 1.3 × MT while leaning forward (•) and during tonic voluntary cocontraction of GM and ST in sitting position (○). D, CUSUMs of the data illustrated in C. Vertical arrow (A, 23 ms; C, 25 ms), expected time of arrival of the GM group I volley at spinal level. Vertical dotted line (A, 41 ms; C, 42 ms), beginning of the EMG facilitation. E, background rectified and averaged (100 sweeps) on-going EMG in ST, Q, GM and TA (as a percentage of MVC, 25–50 ms after GM stimulation) recorded during the same experiment while leaning forward (continuous lines) and during sitting on a high stool (dotted lines).
Figure 5
Figure 5. Modulation of the semitendinosus (ST) on-going EMG (group data) and of the ST H reflex while leaning forward and while sitting
A and B, group data (6 subjects) on the modulation of the on-going ST EMG by a GM volley at 1.3 × MT. Each thin line (and ○) represents one subject and the thick lines (and •) the mean values in the group. Early group I inhibition (A) and late group II (B) facilitation of the ST on-going EMG (difference between conditioned and baseline unconditioned EMG, expressed as a percentage of baseline unconditioned EMG) are compared while leaning forward (right vertical line) and during voluntary cocontraction (left vertical line) at matched level of EMG activity. Mean (±1 s.e.m.) values in the group are shown beneath each corresponding vertical line. C, changes in the ST H reflex produced by GM stimulation (1.5 × MT; difference between conditioned and unconditioned H reflexes, expressed as a percentage of unconditioned H reflexes (set at 15% of Mmax)), plotted against the conditioning-test (interstimulus) interval between GM and sciatic nerve stimulations. Results are compared while leaning forward (•) and during a tonic voluntary cocontraction of GM and ST during sitting (○), at matched level of EMG activity (∼18% of MVC in ST). Each symbol represents the mean (± s.e.m.) of 20 responses in a single subject.

References

    1. Barbeau H, Marchand-Pauvert V, Meunier S, Nicolas G, Pierrot-Deseilligny E. Posture-related changes in heteronymous recurrent inhibition from quadriceps to ankle muscles in humans. Exp Brain Res. 2000;130:345–361. - PubMed
    1. Berger W, Dietz V, Quintern J. Corrective reactions to stumbling in man: neuronal coordination of bilateral leg muscle activity during gait. J Physiol. 1984;405:1–37. - PMC - PubMed
    1. Bove M, Nardone A, Schieppati M. Effects of leg muscle tendon vibration on group Ia and group II reflex responses to stance perturbation in humans. J Physiol. 2003;550:617–630. - PMC - PubMed
    1. Bras H, Cavallari P, Jankowska E, McCrea D. Comparison of effects of monoamines on transmission in spinal pathways from group I and II muscle afferents in the cat. Exp Brain Res. 1989;76:27–37. - PubMed
    1. Burke D, Hagbarth KE, Löfstedt L. Muscle spindle activity in man during shortening and lengthening contractions. J Physiol. 1978;277:131–142. - PMC - PubMed

Publication types