

Spatiotemporal maturation patterns of murine brain quantified by diffusion tensor MRI and deformation-based morphometry
- PMID: 15860588
- PMCID: PMC1100736
- DOI: 10.1073/pnas.0407828102
Spatiotemporal maturation patterns of murine brain quantified by diffusion tensor MRI and deformation-based morphometry
Abstract
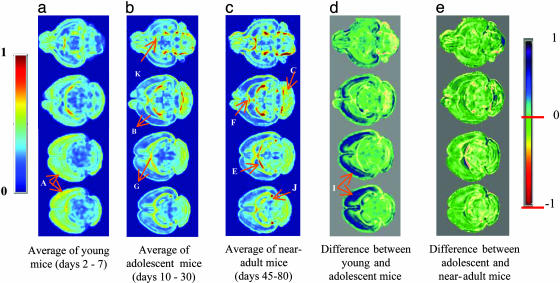
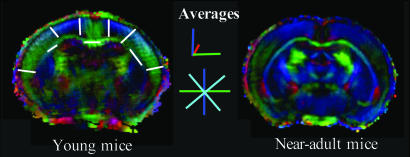
Highly heterogeneous spatiotemporal patterns of maturation of the murine brain during the first 80 postnatal days were examined by high-dimensional deformation-based morphometry applied to high-resolution diffusion tensor MRIs. The maturation profile revealed a sharp contrast between tissue anisotropy changes in the cortex and in major white-matter fibers. Radially oriented tissue anisotropy was measured during the first postnatal week in cortical regions, reflecting the underlying columnar organization of the cortex. Subsequently, tissue anisotropy reduced rapidly, potentially reflecting the growth of randomly oriented dendritic trees that reduce tissue coorientation. Distinct anisotropy patterns were also observed along layer I of the cortex and were attributed to thin fibers oriented parallel to the outer surface. Last, spatially complex patterns of maturation were measured in all major axonal pathways and in the hippocampus, caudate putamen, and cerebellum. This analysis provides a framework for quantifying normative maturation patterns against which phenotypes of mice of different genetic and environmental backgrounds can be contrasted.
Figures


Similar articles
-
Quantification of brain maturation and growth patterns in C57BL/6J mice via computational neuroanatomy of diffusion tensor images.Cereb Cortex. 2009 Mar;19(3):675-87. doi: 10.1093/cercor/bhn112. Epub 2008 Jul 24. Cereb Cortex. 2009. PMID: 18653668 Free PMC article.
-
Brain dysmyelination and recovery assessment by noninvasive in vivo diffusion tensor magnetic resonance imaging.J Neurosci Res. 2006 Feb 15;83(3):392-402. doi: 10.1002/jnr.20742. J Neurosci Res. 2006. PMID: 16397901
-
Late measures of microstructural alterations in severe neonatal hypoxic-ischemic encephalopathy by MR diffusion tensor imaging.Int J Dev Neurosci. 2009 Oct;27(6):607-15. doi: 10.1016/j.ijdevneu.2009.05.012. Epub 2009 Jun 6. Int J Dev Neurosci. 2009. PMID: 19505567
-
The efficacy of a voxel-based morphometry on the analysis of imaging in schizophrenia, temporal lobe epilepsy, and Alzheimer's disease/mild cognitive impairment: a review.Neuroradiology. 2010 Aug;52(8):711-21. doi: 10.1007/s00234-010-0717-2. Epub 2010 May 22. Neuroradiology. 2010. PMID: 20495793 Review.
-
Diffusion-weighted MR of the brain: methodology and clinical application.Radiol Med. 2005 Mar;109(3):155-97. Radiol Med. 2005. PMID: 15775887 Review. English, Italian.
Cited by
-
Plasticity of mouse brain docosahexaenoic acid: modulation by diet and age.Lipids. 2013 Apr;48(4):343-55. doi: 10.1007/s11745-013-3775-5. Epub 2013 Mar 5. Lipids. 2013. PMID: 23460301
-
In vivo fiber tracking in the rat brain on a clinical 3T MRI system using a high strength insert gradient coil.Neuroimage. 2007 Apr 15;35(3):1077-85. doi: 10.1016/j.neuroimage.2007.01.006. Epub 2007 Jan 25. Neuroimage. 2007. PMID: 17331742 Free PMC article.
-
Tensor-based morphometry using scalar and directional information of diffusion tensor MRI data (DTBM): Application to hereditary spastic paraplegia.Hum Brain Mapp. 2018 Dec;39(12):4643-4651. doi: 10.1002/hbm.24278. Epub 2018 Sep 25. Hum Brain Mapp. 2018. PMID: 30253021 Free PMC article.
-
Hierarchical multi-atlas label fusion with multi-scale feature representation and label-specific patch partition.Neuroimage. 2015 Feb 1;106:34-46. doi: 10.1016/j.neuroimage.2014.11.025. Epub 2014 Nov 20. Neuroimage. 2015. PMID: 25463474 Free PMC article.
-
Diffusion tractography of post-mortem human brains: optimization and comparison of spin echo and steady-state free precession techniques.Neuroimage. 2012 Feb 1;59(3):2284-97. doi: 10.1016/j.neuroimage.2011.09.054. Epub 2011 Oct 6. Neuroimage. 2012. PMID: 22008372 Free PMC article.
References
-
- Nolan, P. M., Peters, J., Strivens, M., Rogers, D., Hagan, J., Spurr, N., Gray, I. C., Vizor, L., Brooker, D., Whitehill, E., et al. (2000) Nat. Genet. 25, 440–443. - PubMed
-
- Paigen, K. & Eppig, J. T. (2000) Mamm. Genome 11, 715–717. - PubMed
-
- Nakada, T. & Matzuzawa, H. (1995) Neurosci. Res. 22, 389–398. - PubMed
-
- Kooy, R. F., Reyniers, E., Verhoye, M., Sijbers, J., Bakker, C. E., Oostra, B. A., Willems, P. J. &Van Der Linden, A. (1999) Eur. J. Hum. Genet. 7, 526–532. - PubMed
-
- Toga, A. W. T., Santori, E. M., Hazani, R. & Ambach, K. (1995) Brain Res. Bull. 38, 77–85. - PubMed
Publication types
MeSH terms
Grants and funding
LinkOut - more resources
Full Text Sources
