. 2005 Apr 29;308(5722):697-702.
doi: 10.1126/science.1106340.

Team assembly mechanisms determine collaboration network structure and team performance

Affiliations

Team assembly mechanisms determine collaboration network structure and team performance

Roger Guimerà et al. Science. .

Abstract

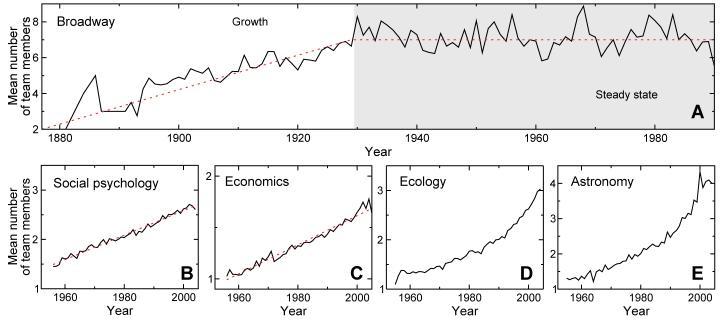
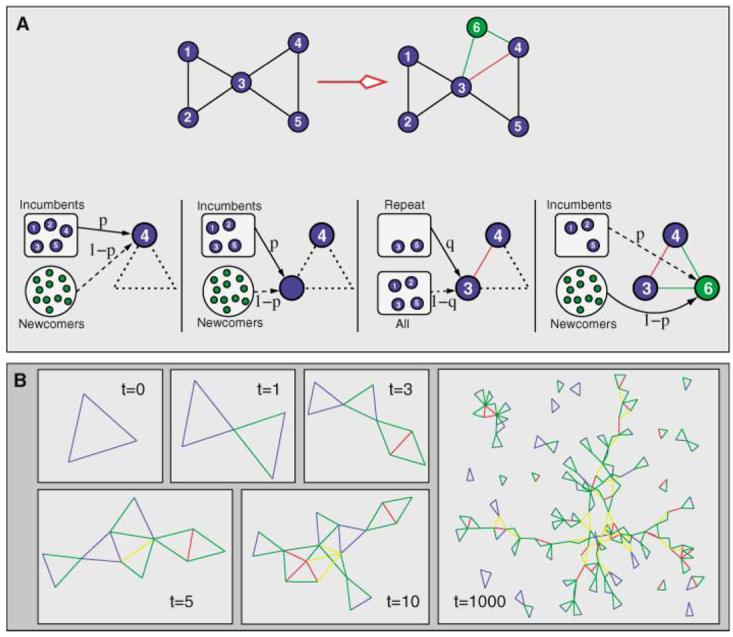
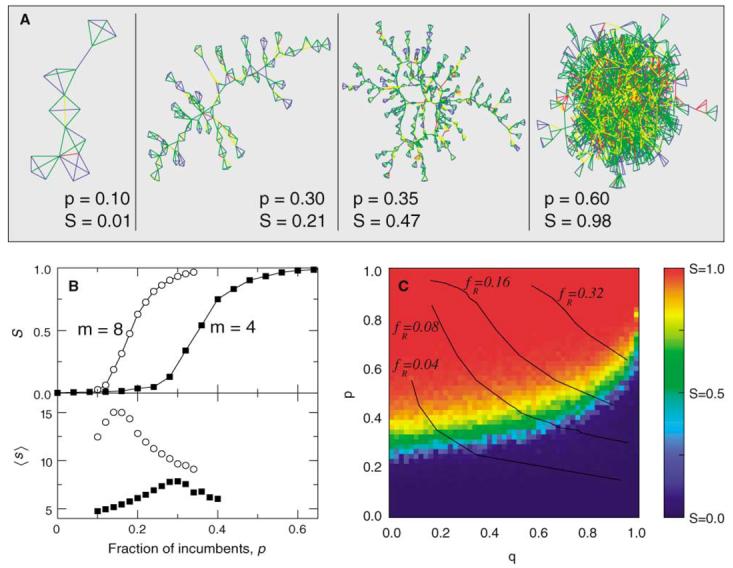
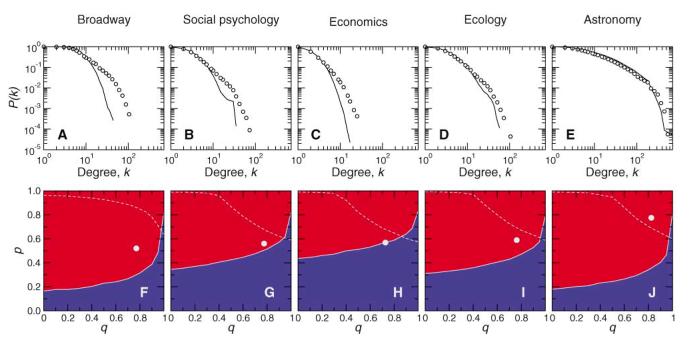
Agents in creative enterprises are embedded in networks that inspire, support, and evaluate their work. Here, we investigate how the mechanisms by which creative teams self-assemble determine the structure of these collaboration networks. We propose a model for the self-assembly of creative teams that has its basis in three parameters: team size, the fraction of newcomers in new productions, and the tendency of incumbents to repeat previous collaborations. The model suggests that the emergence of a large connected community of practitioners can be described as a phase transition. We find that team assembly mechanisms determine both the structure of the collaboration network and team performance for teams derived from both artistic and scientific fields.


Figures

Fig. 1
Fig. 1
Time evolution of the typical number of team members in (A) the BMI and scientific collaborations in the disciplines of (B) social psychology, (C) economics, (D) ecology, and (E) astronomy.
Fig. 2
Fig. 2
Modeling the emergence of collaboration networks in creative enterprises. (A) Creation of a team with m = 3 agents. Consider, at time zero, a collaboration network comprising five agents, all incumbents (blue circles). Along with the incumbents, there is a large pool of newcomers (green circles) available to participate in new teams. Each agent in a team has a probability p of being drawn from the pool of incumbents and a probability 1 – p of being drawn from the pool of newcomers. For the second and subsequent agents selected from the incumbents' pool: (i) with probability q, the new agent is randomly selected from among the set of collaborators of a randomly selected incumbent already in the team; (ii) otherwise, he or she is selected at random among all incumbents in the network. For concreteness, let us assume that incumbent 4 is selected as the first agent in the new team (leftmost box). Let us also assume that the second agent is an incumbent, too (center-left box). In this example, the second agent is a past collaborator of agent 4, specifically agent 3 (center-right box). Lastly, the third agent is selected from the pool of newcomers; this agent becomes incumbent 6 (rightmost box). In these boxes and in the following panels and figures, blue lines indicate newcomer-newcomer collaborations, green lines indicate newcomer-incumbent collaborations, yellow lines indicate new incumbent-incumbent collaborations, and red lines indicate repeat collaborations. (B) Time evolution of the network of collaborations according to the model for p = 0.5, q = 0.5, and m = 3.
Fig. 3
Fig. 3
Predictions of the model. (A) Phase transition in the structure of the collaboration network. We plot only the largest cluster in the network. For small p, the network is formed by numerous small clusters (p = 0.10). At the critical point pc, the tipping point, a large cluster emerges, that is, a cluster that contains a substantial fraction of the agents. In the vicinity of the transition, the largest cluster has an almost linear or branched structure (p = 0.30). As p increases, the largest cluster starts to have loops (p = 0.35) and eventually becomes a densely connected cluster containing essentially all nodes in the network (p = 0.60). We show results for q = 0.5 and m = 4, where m is the number of agents in a team. (B) The transition described in (A) can be characterized by the fraction S of nodes that belong to the giant component, the order parameter, and the average size 〈s〉 of the other clusters, the susceptibility (33). The model displays a second-order percolation transition as the fraction p of incumbents increases from 0 to 1. The transition occurs for p = pc, which coincides with the maximum of 〈s〉. Note that pc is a decreasing function of m. We show results for q = 0.5 and m = 4 and m = 8. (C) We display graphically the value of S as a function of p and q for m = 4. For any value of q, the model displays the percolation transition, and the critical fraction pc depends on q, defining a percolation line pc(m,q). The critical line pc(m,q) is an increasing function of q. Even though the order parameter S is an important parameter to quantify the structure of the network, not all points with the same S, that is, all points represented with the same color, correspond to fields with identical properties. This result is made clear by the lines of equal fR. The upper-right corner of the (p,q) plane is characterized by fR close to one, whereas the lower-left corner corresponds to fR close to zero. As we show in Fig. 4, all fields considered have parameter values above the transition line.
Fig. 4
Fig. 4
Network structure of different creative fields. Degree distributions for (A) the BMI, (B) the field of social psychology, (C) the field of economics, (D) the field of ecology, and (E) the field of astronomy. We carried out with the use of the sequence {m(t)} of team sizes found in the empirical data and with the values of p and q estimated from the measured fractions of the different types of links. We present the predictions of the model with the lines and the empirical degree distributions with the open circles. For all cases considered, the data falls within the 95% confidence intervals of the predictions of the model. The (p,q) parameter space of the network of collaborators is shown for (F) the BMI, (G) the field of social psychology, (H) the field of economics, (I) the field of ecology, and (J) the field of astronomy. The solid lines separating the red and the blue regions indicate the values of p and q for which 50% of the nodes belong to the largest cluster, that is, the percolation transition at which a giant component, the invisible college, emerges. The distance from the percolation line predicts the overall structure of the network. For example, the networks in astronomy are well above the tipping line and have a very dense structure (Table 1). In contrast, all other fields are close to the transition and have relatively sparse giant components. Another important characteristic of the network is provided by the value of fR. To help with the interpretation of the results, we plot with dotted lines the curves for fR = 0.32. For four of the creative networks considered, we find fR < 0.25. For astronomy, we find fR = 0.39.
Fig. 5
Fig. 5
Relation between team assembly mechanisms, network structure, and performance. We calculate the values of p, q, and S for several journals in each of the four scientific fields considered. In a few cases, q should be larger than one in order to reproduce the empirical values of fR; in these cases, q is considered one and the corresponding points are shaded. We plot the values of p, q, and S as a function of the impact factor of the journal and then use the Spearman rank-order correlation coefficient rs to determine significant correlations. Shaded graphs indicate significantly correlated variables at the 95% confidence level.

Comment in

References

    1. Granovetter MS. Am. J. Sociol. 1973;78:1360.
    1. Reagans R, Zuckerman EW. Organ. Sci. 2001;12:502.
    1. Burt R. Am. J. Sociol. 2004;110:349.
    1. Uzzi B, Spiro J. Am. J. Sociol. in press.
    1. Larson JR, Christensen C, Abbott AS, Franz TM. J. Pers. Soc. Psychol. 1996;71:315. - PubMed

Publication types