. 2005 Apr 28;33(8):2421-32.
doi: 10.1093/nar/gki331. Print 2005.

Dissecting eukaryotic translation and its control by ribosome density mapping

Affiliations

Dissecting eukaryotic translation and its control by ribosome density mapping

Yoav Arava et al. Nucleic Acids Res. .

Abstract

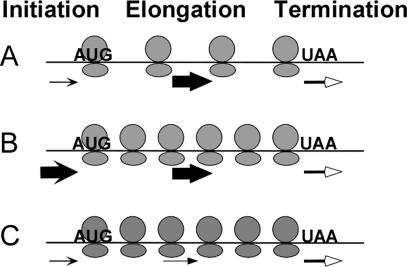
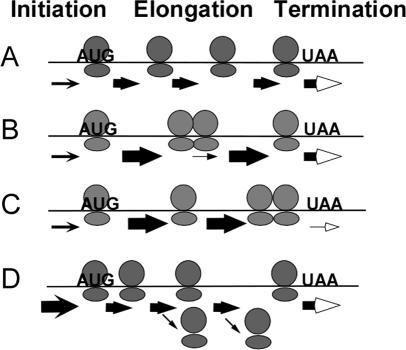
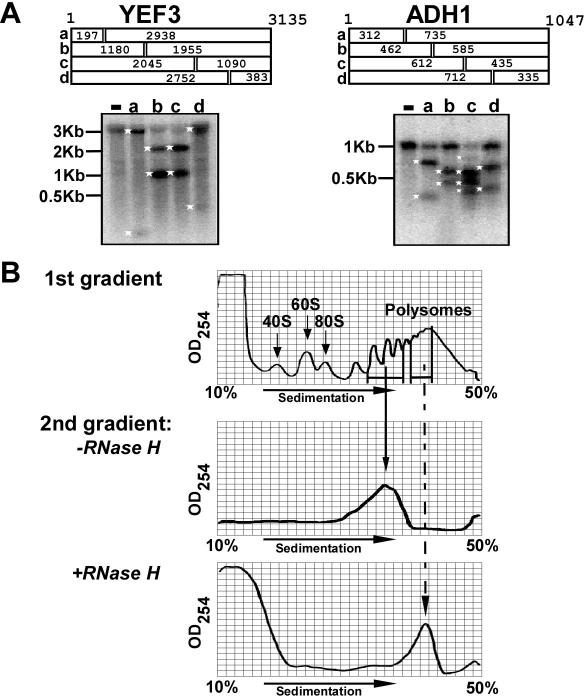
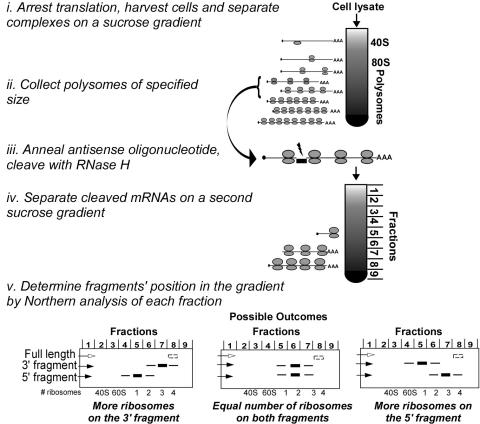
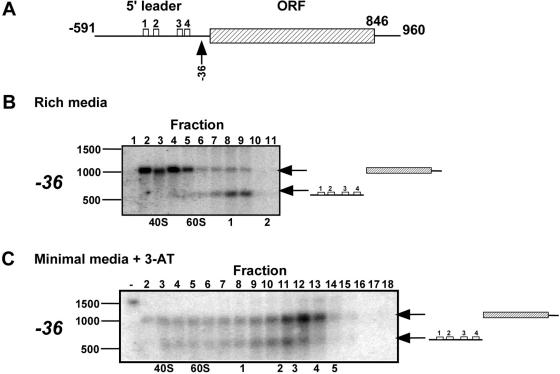
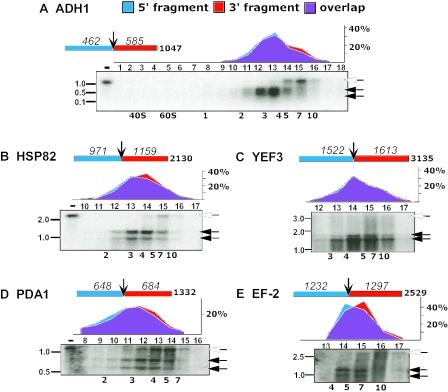
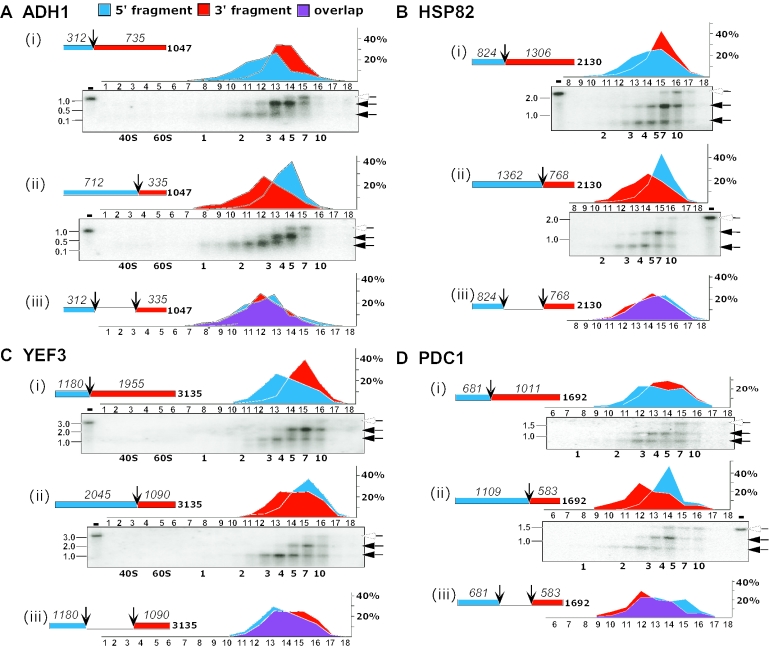
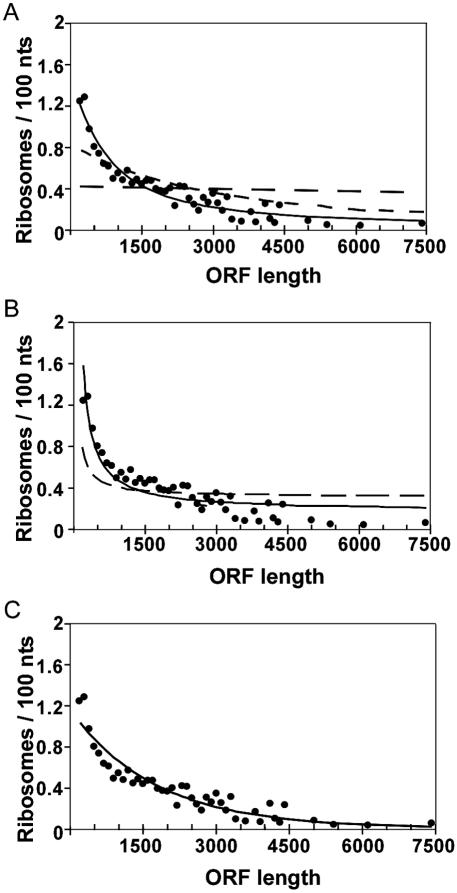
Translation of an mRNA is generally divided into three stages: initiation, elongation and termination. The relative rates of these steps determine both the number and position of ribosomes along the mRNA, but traditional velocity sedimentation assays for the translational status of mRNA determine only the number of bound ribosomes. We developed a procedure, termed Ribosome Density Mapping (RDM), that uses site-specific cleavage of polysomal mRNA followed by separation on a sucrose gradient and northern analysis, to determine the number of ribosomes associated with specified portions of a particular mRNA. This procedure allows us to test models for translation and its control, and to examine properties of individual steps of translation in vivo. We tested specific predictions from the current model for translational control of GCN4 expression in yeast and found that ribosomes were differentially associated with the uORFs elements and coding region under different growth conditions, consistent with this model. We also mapped ribosome density along the ORF of several mRNAs, to probe basic kinetic properties of translational steps in yeast. We found no detectable decline in ribosome density between the 5' and 3' ends of the ORFs, suggesting that the average processivity of elongation is very high. Conversely, there was no queue of ribosomes at the termination site, suggesting that termination is not very slow relative to elongation and initiation. Finally, the RDM results suggest that less frequent initiation of translation on mRNAs with longer ORFs is responsible for the inverse correlation between ORF length and ribosomal density that we observed in a global analysis of translation. These results provide new insights into eukaryotic translation in vivo.


Figures

Figure 1
Figure 1
The number of ribosomes bound to an mRNA reflects the interplay between initiation, elongation and termination. The arrow thickness represents the relative rate constants for initiation (concave arrowheads), elongation (closed arrowheads) and termination (open arrowheads). Note the different number of bound ribosomes in (A–C).
Figure 2
Figure 2
The position of ribosomes along an mRNA provides additional information about initiation, elongation and termination. Models for mRNAs with similar number of ribosomes but different distributions of ribosomes along the mRNA are presented. As in Figure 1, the arrow thickness represents the relative rate constant for steps. In (D), the downward arrows represent ribosomes dissociation due to limited processivity.
Figure 3
Figure 3
Controls for RDM. (A) Specificity of the RNase H reactions. Antisense ODNs complementary to various positions of ADH1 or YEF3 were annealed to polysomal mRNA. The expected lengths (in nt) of the cleavage products are shown schematically at the top of each panel. Following annealing, RNase H was added and reactions proceeded for 20 min. Samples were then subjected to northern analysis using radiolabeled full-length DNA probe. Size markers are shown at the left and white asterisks indicate cleavage products. (−) No oligo added and the letters correspond to the schematic above. (B) No detectable ribosome dissociation during processing steps. The upper panel (first gradient) is an OD254 trace of a sucrose gradient from which two different polysomal fractions were collected. One fraction (mRNAs associated with 3–5 ribosomes) was resolved on a second gradient following incubation for 1 h at 37°C (second gradient, −RNase H panel) and the other fraction (mRNAs associated with 5–10 ribosomes) was annealed with an antisense ODN complementary to ADH1 around position 462, subjected to RNase H reaction, and then separated on a sucrose gradient (second gradient, +RNase H). The sedimentation positions of the 40S, 60S, 80S and polysomes are indicated.
Scheme 1
Scheme 1
Outline of Ribosome Density Mapping Protocol.
Figure 4
Figure 4
Testing the scanning and reinitiation model for GCN4 translation control by RDM. (A) Schematic structure of GCN4 mRNA. The four uORFs located on the 5′-leader are depicted as open boxes, and the GCN4 coding ORF is depicted as a hatched box. Numbers indicate distances (in nt) from the AUG and the arrow points to the cleavage position. (B and C) Polysomal RNA was isolated from cells grown in rich medium (B) or in minimal medium supplemented with 3-aminotriazole for 30 min (C). The GCN4 mRNA was cleaved with an antisense ODN complementary to sequence upstream of the AUG codon (the ODN is expected to cut at position −36). Cleavage reactions were separated on a sucrose gradient into 18 fractions, and the indicated fractions were analyzed by northern analysis. Gel migration distance of size markers is shown to the left and sedimentation positions of the 40S, 60S and ribosome–mRNA complexes are indicated at the bottom of each panel. Migration position of the cleaved fragments is shown to the right of each panel.
Figure 5
Figure 5
Comparison of the ribosomal density on two halves of individual mRNAs. Polysomal mRNA was isolated from yeast cells and cleaved with ODNs complementary to the positions near the center of each ORF (see text). Schematic representation of the coding region and the expected sizes of the cleavage products are shown for each mRNA (assuming cleavage in the center of the ODN:mRNA duplex). Samples were separated on sucrose gradients and, in all cases, 18 fractions were collected. The fractions indicated in each panel were subjected to northern analysis and hybridized with radiolabeled probes recognizing ADH1 (A), HSP82 (B), YEF3 (C), PDA1 (D) and EF-2 (E). On each northern blot, the open arrowheads indicate the full-length mRNA and the closed arrowheads indicate the two cleavage products. The assignment of the cleavage products as a 5′- or a 3′-fragment was based on the expected migration distance for an mRNA species corresponding to the length of the coding region and the untranslated regions (40). Labeling of the northern blots is as in Figure 4. The number of ribosomes associated with the full-length mRNA corresponds to the number of ribosomes in the fraction pooled from the first sucrose gradient for RNase H treatment. The graph in each panel shows the Phosphorimager quantifications of the 5′-cleavage product (blue) and the 3′-cleavage product (red), expressed as percent of total signal in the probed fractions. The overlap in the signal is shown in purple.
Figure 6
Figure 6
Comparison of the ribosomal density at the ends of individual mRNAs. Polysomal mRNA was isolated from yeast cells and RNase H-cleaved in the presence of antisense ODNs complementary to positions at the 3′ end of the first third [(i) in each panel] and the second third [(ii) in each panel] of the coding region. Schematic representations of the coding region and the expected sizes of the cleavage products are shown for each mRNA. Samples were separated on sucrose gradients and, in all cases, 18 fractions were collected. The fractions indicated in each panel were subjected to northern analysis and hybridized with radiolabeled probes recognizing ADH1 (A), HSP82 (B), YEF3 (C) and PDC1 (D). Labeling is as in Figure 4. The graphs in (i) and (ii) of each panel show the phosphorimager quantification results of the 5′-cleavage product (blue) and the 3′-cleavage product (red), expressed as percent of total signal in the probed fractions. The graph in (iii) presents the signals of the short fragments from (i) (blue) and (ii) (red) with the overlap shown in purple.
Figure 7
Figure 7
Comparison of experimentally measured ribosomal densities to predictions from incomplete processivity, slow termination and slow initiation models. Ribosomal densities measured for 739 mRNAs by microarray analysis of polysomal fractions (7) are plotted versus ORF length (black circles). Each circle represents the average density for ORF lengths binned in 100 nt intervals (up to 4400 nt). Lines represent predicted density values by each model (the details of density calculations for each model are described in the Methods Supplement). (A) Incomplete processivity (model 1). Solid line represents the best fit to the experimentally measured densities with a processivity level of 99.30% per elongation step. Predicted values for higher processivity levels, corresponding to limits obtained from RDM of 99.8% processivity (short-dashes) and 99.99% processivity (long-dashes) are shown for comparison. (B) Slow termination (model 2). The solid line represents the best fit for the experimentally measured densities, which corresponding to a queue of three ribosomes at the 3′ end of the ORF. An example of the predicted density with queue of one ribosome is also shown (long dashes line). (C) Slow initiation (model 3). The line represents the best fit to the experimentally measured densities for a model in which initiation rates decrease exponentially with increase in mRNA length.

Similar articles

Cited by

References

    1. Rickwood D. Preparative Centrifugation. A Practical Approach, 2nd edn. Oxford, New York: 1992.
    1. Warner J.R., Knopf P.M., Rich A. A multiple ribosomal structure in protein synthesis. Proc. Natl Acad. Sci. USA. 1963;49:122–129. - PMC - PubMed
    1. Ashe M.P., De Long S.K., Sachs A.B. Glucose depletion rapidly inhibits translation initiation in yeast. Mol. Biol. Cell. 2000;11:833–848. - PMC - PubMed
    1. Dickson L.M., Brown A.J. mRNA translation in yeast during entry into stationary phase. Mol. Gen. Genet. 1998;259:282–293. - PubMed
    1. Proweller A., Butler J.S. Ribosomal association of poly(A)-binding protein in poly(A)-deficient Saccharomyces cerevisiae. J. Biol. Chem. 1996;271:10859–10865. - PubMed

Publication types

MeSH terms