

Relative contribution of PDX-1, MafA and E47/beta2 to the regulation of the human insulin promoter
- PMID: 15862113
- PMCID: PMC1180732
- DOI: 10.1042/BJ20041891
Relative contribution of PDX-1, MafA and E47/beta2 to the regulation of the human insulin promoter
Abstract
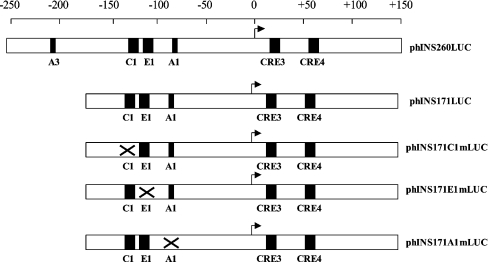
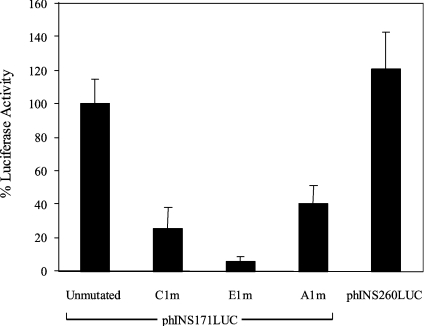
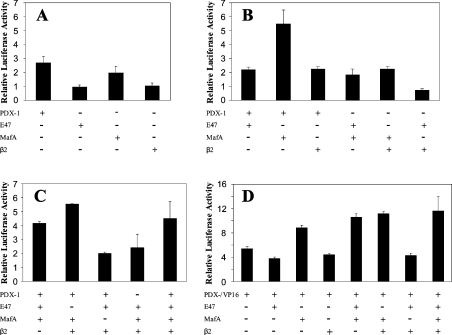
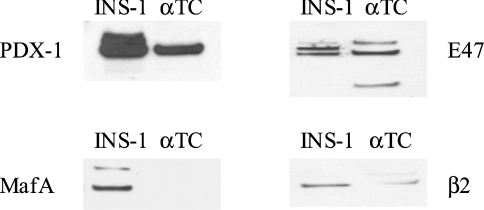
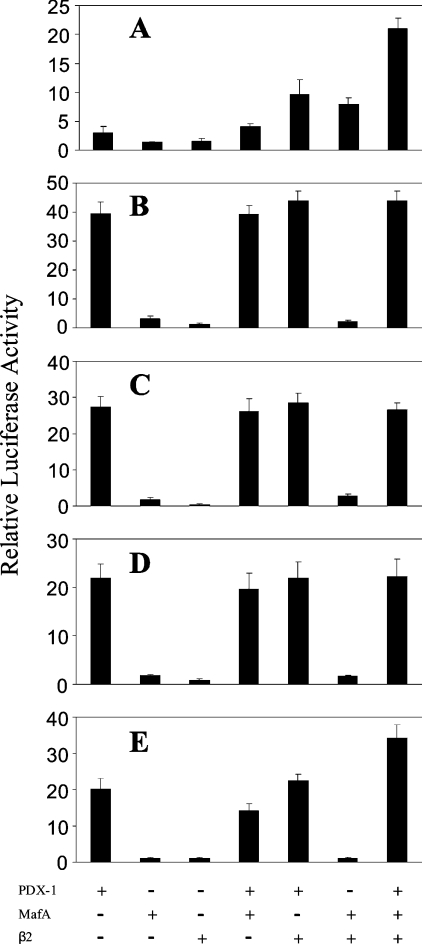
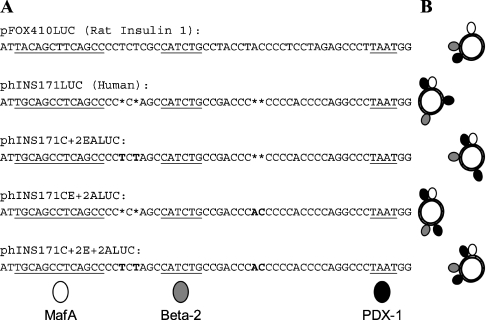
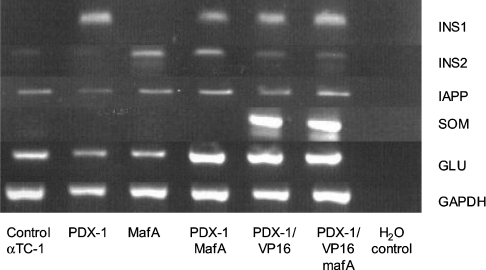
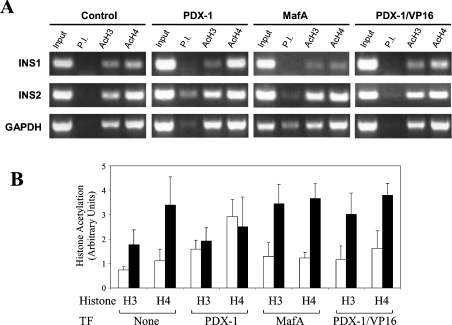
The insulin promoter binds a number of tissue-specific and ubiquitous transcription factors. Of these, the homoeodomain protein PDX-1 (pancreatic duodenal homeobox factor-1), the basic leucine zipper protein MafA and the basic helix-loop-helix heterodimer E47/BETA2 (beta-cell E box transactivator 2; referred to here as beta2) bind to important regulatory sites. Previous studies have shown that PDX-1 can interact synergistically with E47 and beta2 to activate the rat insulin 1 promoter. The aim of the present study was to determine the relative contribution of PDX-1, MafA and E47/beta2 in regulating the human insulin promoter, and whether these factors could interact synergistically in the context of the human promoter. Mutagenesis of the PDX-1, MafA and E47/beta2 binding sites reduced promoter activity by 60, 74 and 94% respectively, in INS-1 beta-cells. In the islet glucagonoma cell line alphaTC1.6, overexpression of PDX-1 and MafA separately increased promoter activity approx. 2.5-3-fold, and in combination approx. 6-fold, indicating that their overall effect was additive. Overexpression of E47 and beta2 had no effect. In HeLa cells, PDX-1 stimulated the basal promoter by approx. 40-fold, whereas MafA, E47 and beta2 each increased activity by less than 2-fold. There was no indication of any synergistic effects on the human insulin promoter. On the other hand, the rat insulin 1 promoter and a mutated version of the human insulin promoter, in which the relevant regulatory elements were separated by the same distances as in the rat insulin 1 promoter, did exhibit synergy. PDX-1 was shown further to activate the endogenous insulin 1 gene in alphaTC1.6 cells, whereas MafA activated the insulin 2 gene. In combination, PDX-1 and MafA activated both insulin genes. Chromatin immunoprecipitation assays confirmed that PDX-1 increased the association of acetylated histones H3 and H4 with the insulin 1 gene and MafA increased the association of acetylated histone H3 with the insulin 2 gene.
Figures
Similar articles
-
Synergistic activation of the insulin gene promoter by the beta-cell enriched transcription factors MafA, Beta2, and Pdx1.Biochim Biophys Acta. 2005 Jul 25;1730(1):41-6. doi: 10.1016/j.bbaexp.2005.05.009. Biochim Biophys Acta. 2005. PMID: 15993959
-
Sterol regulatory element-binding proteins activate insulin gene promoter directly and indirectly through synergy with BETA2/E47.J Biol Chem. 2005 Oct 14;280(41):34577-89. doi: 10.1074/jbc.M506718200. Epub 2005 Jul 29. J Biol Chem. 2005. PMID: 16055439
-
The islet beta cell-enriched MafA activator is a key regulator of insulin gene transcription.J Biol Chem. 2005 Mar 25;280(12):11887-94. doi: 10.1074/jbc.M409475200. Epub 2005 Jan 20. J Biol Chem. 2005. PMID: 15665000
-
Roles and regulation of transcription factor MafA in islet beta-cells.Endocr J. 2007 Dec;54(5):659-66. doi: 10.1507/endocrj.kr-101. Epub 2007 Aug 30. Endocr J. 2007. PMID: 17785922 Review.
-
Role of PDX-1 and MafA as a potential therapeutic target for diabetes.Diabetes Res Clin Pract. 2007 Sep;77 Suppl 1:S127-37. doi: 10.1016/j.diabres.2007.01.046. Epub 2007 Apr 20. Diabetes Res Clin Pract. 2007. PMID: 17449132 Review.
Cited by
-
Recessive mutations in the INS gene result in neonatal diabetes through reduced insulin biosynthesis.Proc Natl Acad Sci U S A. 2010 Feb 16;107(7):3105-10. doi: 10.1073/pnas.0910533107. Epub 2010 Jan 28. Proc Natl Acad Sci U S A. 2010. PMID: 20133622 Free PMC article.
-
Spint1 disruption in mouse pancreas leads to glucose intolerance and impaired insulin production involving HEPSIN/MAFA.Nat Commun. 2024 Dec 3;15(1):10537. doi: 10.1038/s41467-024-54927-2. Nat Commun. 2024. PMID: 39627229 Free PMC article.
-
Cx36 is a target of Beta2/NeuroD1, which associates with prenatal differentiation of insulin-producing β cells.J Membr Biol. 2012 Jun;245(5-6):263-73. doi: 10.1007/s00232-012-9447-1. Epub 2012 Jun 23. J Membr Biol. 2012. PMID: 22729650
-
Knockouts of SOD1 and GPX1 exert different impacts on murine islet function and pancreatic integrity.Antioxid Redox Signal. 2011 Feb 1;14(3):391-401. doi: 10.1089/ars.2010.3302. Epub 2010 Sep 29. Antioxid Redox Signal. 2011. PMID: 20586612 Free PMC article.
-
Repression of COUP-TFI Improves Bone Marrow-Derived Mesenchymal Stem Cell Differentiation into Insulin-Producing Cells.Mol Ther Nucleic Acids. 2017 Sep 15;8:220-231. doi: 10.1016/j.omtn.2017.06.016. Epub 2017 Jun 23. Mol Ther Nucleic Acids. 2017. PMID: 28918023 Free PMC article.
References
-
- Melloul D., Marshak S., Cerasi E. Regulation of insulin gene transcription. Diabetologia. 2002;45:309–326. - PubMed
-
- German M., Ashcroft S., Docherty K., Edlund H., Edlund T., Goodison S., Imura H., Kennedy G., Madsen O., Melloul D. The insulin gene promoter. A simplified nomenclature. Diabetes. 1995;44:1002–1004. - PubMed
-
- Naya F. J., Stellrecht C. M., Tsai M. J. Tissue-specific regulation of the insulin gene by a novel basic helix-loop-helix transcription factor. Genes Dev. 1995;9:1009–1019. - PubMed
Publication types
MeSH terms
Substances
Grants and funding
LinkOut - more resources
Full Text Sources
Other Literature Sources
Medical
Research Materials