. 2005 Jul;4(7):1002-8.
doi: 10.1074/mcp.M500064-MCP200. Epub 2005 Apr 28.

Precise and parallel characterization of coding polymorphisms, alternative splicing, and modifications in human proteins by mass spectrometry

Affiliations

Precise and parallel characterization of coding polymorphisms, alternative splicing, and modifications in human proteins by mass spectrometry

Michael J Roth et al. Mol Cell Proteomics. 2005 Jul.

Abstract

The human proteome is a highly complex extension of the genome wherein a single gene often produces distinct protein forms due to alternative splicing, RNA editing, polymorphisms, and posttranslational modifications. Such biological variation compounded by the high sequence identity within gene families currently overwhelms the complete and routine characterization of mammalian proteins by MS. A new data base of human proteins (and their possible variants) was created and searched using tandem mass spectrometric data from intact proteins. This first application of top down MS/MS to wild-type human proteins demonstrates both gene-specific identification and the unambiguous characterization of multifaceted mass shifts (Deltam values). Such Deltam values found from the precise identification of 45 protein forms from HeLa cells reveal 34 coding single nucleotide polymorphisms, two protein forms from alternative splicing, and 12 diverse modifications (not including simple N-terminal processing), including a previously unknown phosphorylation at 10% occupancy. Automated protein identification was achieved with a median expectation value of 10(-13) and often occurred simultaneously with dissection of diverse sources of protein variability as they occur in combination. Top down MS therefore has a bright future for enabling precise annotation of gene products expressed from the human genome by non-mass spectrometrists.


Figures

Figure 1
Figure 1
Complete characterization of multiple cSNP-containing proteins from one fraction. a) Partial ESI/Q-FT mass spectrum (10 scans) of an ALS-PAGE/RPLC sample from human cells. b) Tandem mass spectrum (50 scans) from collisional dissociation of a 6.7 kDa protein selectively accumulated and fragmented using the quadrupole-enhancement to FTMS. c) Tandem mass spectrum (50 scans, axial-CAD) from dissociation of the 11.6 kDa species at 905 m/z. d) and e) Graphical fragment maps generated upon database retrieval using the MS/MS spectra of proteins highlighted in Figure 1a (insets). Tall and short markers represent fragment ions produced from CAD (b/y-type) and ECD (c/z-type), respectively.
Figure 2
Figure 2
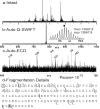
Intact and MS/MS fragmentation spectra providing high retrieval specificity obtained for a modified, cSNP containing member of a highly conserved gene family. a) Broadband ESI FTMS spectrum (10 scans) of an ALS-PAGE/RPLC fraction from human HeLa cells. b) Auto-SWIFT isolation spectrum (10 scans) of the 18+ charge state at 779 m/z. c) Partial auto-ECD MS/MS spectrum (100 scans) of the species of Figure 2b. d) The graphical fragment map generated upon database retrieval from ECD and CAD fragmentation data illustrating the position of the cSNP within the histone H2A gene.
Figure 3
Figure 3
Characterization and semi-quantitation of alternative splice variants using Top Down MS/MS. a) Partial broadband MS spectrum for alternatively spliced species of 11977.9 Da and 12106.9 Da. b) and c) ECD and IRMPD MS/MS spectra of SWIFT isolated species from Figure 3a. d) Fragmentation details from MS/MS spectra of Figure 3b and 3c. e) Alternative splicing diagram for the ProTα gene illustrating the adjacent splice acceptors due to the GAGGAG motif. The tall blue and short red markers on the fragment maps indicate ions formed by IRMPD and ECD, respectively.
Figure 4
Figure 4
Characterization of a previously unknown phosphoprotein using Top Down MS/MS. a) Intact MS of 10+ charge states of species at 10191.3 Da and 10271.4 Da (~10:1 ratio). b) ECD fragmentation results for the 10+ charge state of the species at 10271.4 Da illustrating localization of the 80 Da Δm to Thr2 or Ser3. Red markers indicate ECD ions that matched the unmodified sequence, blue markers match ions that harbor the +80 Da Δm (as well as N-terminal acetylation).
Supplementary Figure 1
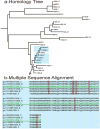
An illustration of the biological complexity of MS analysis of members of highly conserved gene families. a) Homology tree generated using ClustalW sequence alignments illustrating the genetic distance between 17 H2A gene family members and their variants (29 total protein forms), not including cSNP containing forms. b) ClustalW sequence alignment of H2A.O and the 5 most closely related family members from Supplementary Figure 1a illustrating 5 distinct residue changes.

Similar articles

Cited by

References

    1. Aebersold R, Mann M. Mass spectrometry-based proteomics. Nature. 2003;422:198–207. - PubMed
    1. Yates JR. Mass spectral analysis in proteomics. Annu Rev Biophys Biomol Struct. 2004;33:297–316. - PubMed
    1. Sam-Yellowe TY, Florens L, Johnson JR, Wang T, Drazba JA, Le Roch KG, Zhou Y, Batalov S, Carucci DJ, Winzeler EA, Yates JR., 3rd A Plasmodium gene family encoding Maurer’s cleft membrane proteins: structural properties and expression profiling. Genome Res. 2004;14:1052–1059. - PMC - PubMed
    1. Rappsilber J, Ryder U, Lamond AI, Mann M. Large-scale proteomic analysis of the human spliceosome. Genome Res. 2002;12:1231–1245. - PMC - PubMed
    1. Hines WM, Parker K, Peltier J, Patterson DH, Vestal ML, Martin SA. Protein identification and protein characterization by high-performance time-of-flight mass spectrometry. J Protein Chem. 1998;17:525–526. - PubMed

Publication types

LinkOut - more resources