

Trapping, deformation, and rotation of giant unilamellar vesicles in octode dielectrophoretic field cages
- PMID: 15863477
- PMCID: PMC1366554
- DOI: 10.1529/biophysj.104.050401
Trapping, deformation, and rotation of giant unilamellar vesicles in octode dielectrophoretic field cages
Abstract
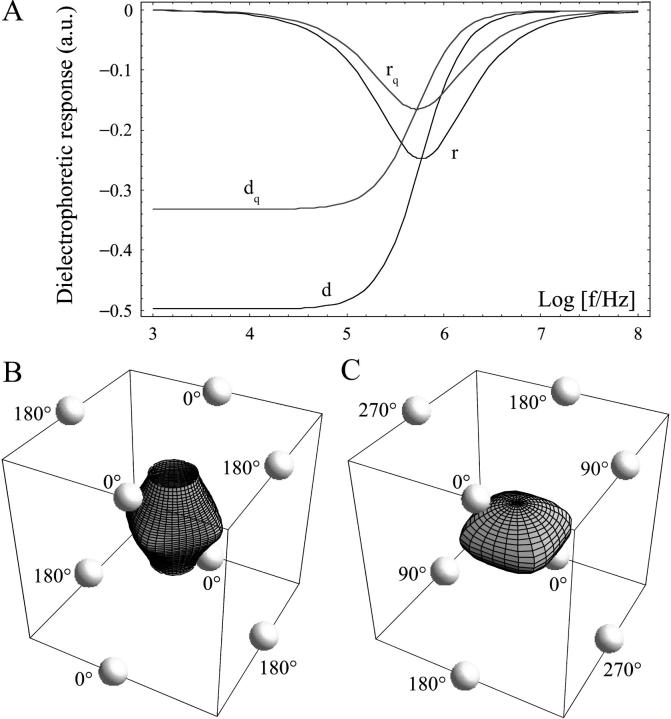
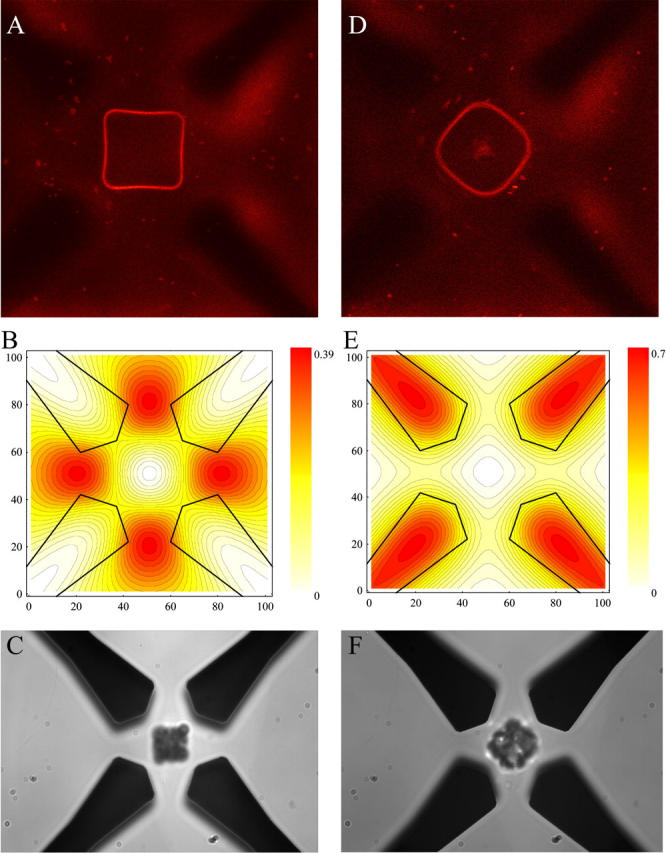
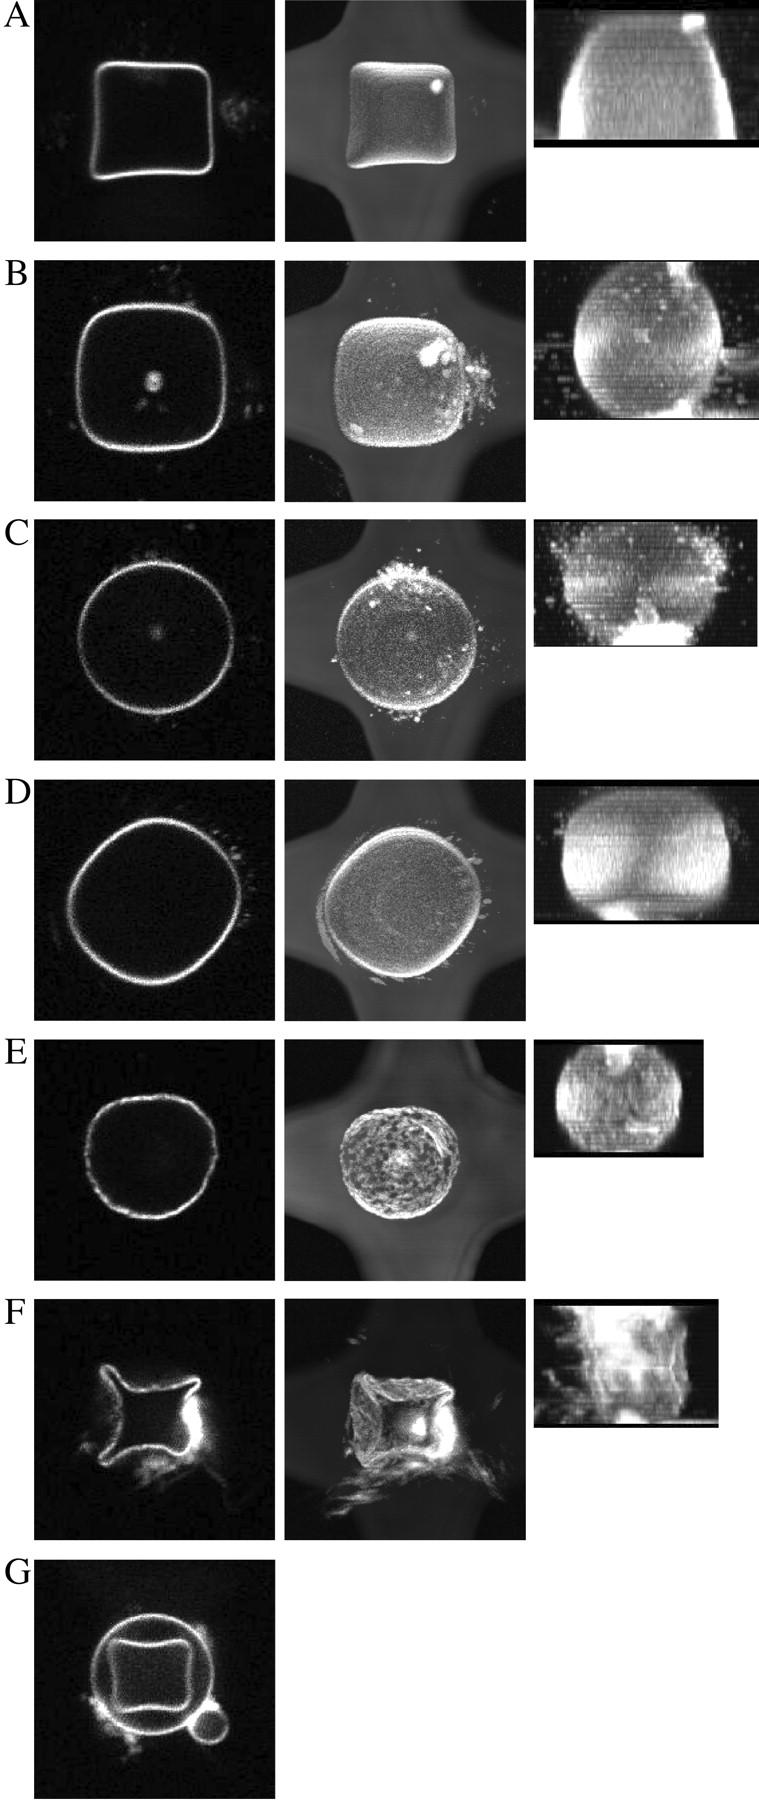
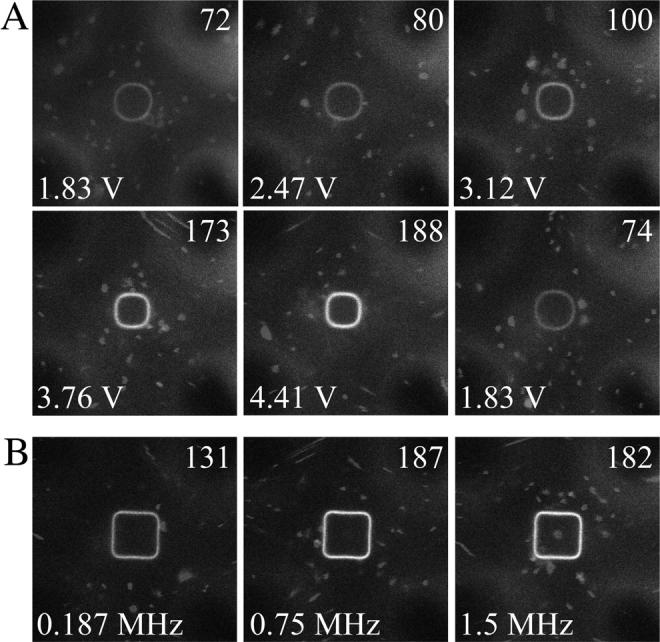
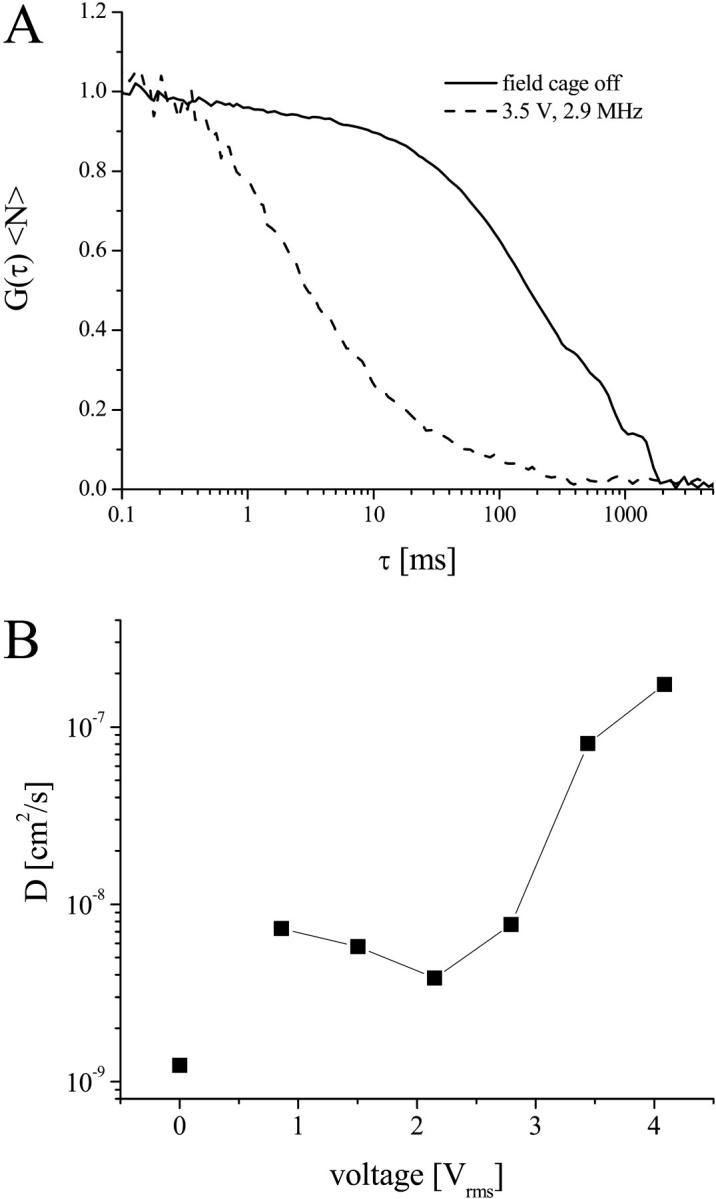
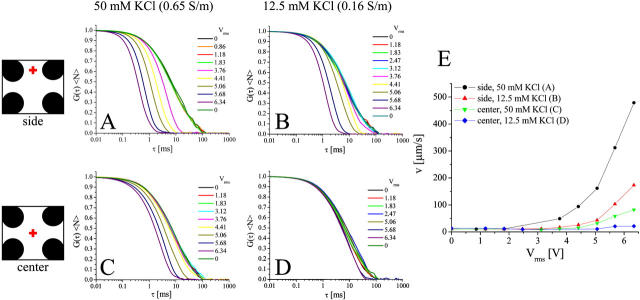
The behavior of freestanding lipid bilayer membranes under the influence of dielectric force potentials was studied by trapping, holding, and rotating individual giant unilamellar vesicles (GUVs) inside dielectrophoretic microfield cages. Using laser scanning confocal microscopy and three-dimensional image reconstructions of GUVs labeled with fluorescent membrane probes, field strength and frequency-dependent vesicle deformations were observed which are explained by calculations of the dielectric force potentials inside the cage. Dynamical membrane properties under the influence of the field cage were studied by fluorescence correlation spectroscopy, circumventing potential artifacts associated with measurements involving GUV immobilization on support surfaces. Lipid transport could be accelerated markedly by the applied fields, aided by hydrodynamic fluid streaming which was also studied by fluorescence correlation spectroscopy.
Figures
Similar articles
-
Characterization of interaction between cationic lipid-oligonucleotide complexes and cellular membrane lipids using confocal imaging and fluorescence correlation spectroscopy.Biophys J. 2005 Jan;88(1):305-16. doi: 10.1529/biophysj.104.043133. Epub 2004 Oct 29. Biophys J. 2005. PMID: 15516528 Free PMC article.
-
Spatial-temporal studies of membrane dynamics: scanning fluorescence correlation spectroscopy (SFCS).Biophys J. 2004 Aug;87(2):1260-7. doi: 10.1529/biophysj.103.036483. Biophys J. 2004. PMID: 15298928 Free PMC article.
-
Single GUV method reveals interaction of tea catechin (-)-epigallocatechin gallate with lipid membranes.Biophys J. 2007 May 1;92(9):3178-94. doi: 10.1529/biophysj.106.097105. Epub 2007 Feb 9. Biophys J. 2007. PMID: 17293394 Free PMC article.
-
Recent developments in fluorescence correlation spectroscopy for diffusion measurements in planar lipid membranes.Int J Mol Sci. 2010 Jan 28;11(2):427-457. doi: 10.3390/ijms11020427. Int J Mol Sci. 2010. PMID: 20386647 Free PMC article. Review.
-
Quantitative optical microscopy and micromanipulation studies on the lipid bilayer membranes of giant unilamellar vesicles.Chem Phys Lipids. 2014 Jul;181:99-120. doi: 10.1016/j.chemphyslip.2014.02.009. Epub 2014 Mar 13. Chem Phys Lipids. 2014. PMID: 24632023 Review.
Cited by
-
Observations of Membrane Domain Reorganization in Mechanically Compressed Artificial Cells.Chembiochem. 2019 Oct 15;20(20):2666-2673. doi: 10.1002/cbic.201900167. Epub 2019 Oct 1. Chembiochem. 2019. PMID: 31087814 Free PMC article.
-
Electric pulses induce cylindrical deformations on giant vesicles in salt solutions.Biophys J. 2006 Sep 1;91(5):1778-86. doi: 10.1529/biophysj.106.081620. Epub 2006 Jun 9. Biophys J. 2006. PMID: 16766621 Free PMC article.
-
Combining patch-clamping and fluorescence microscopy for quantitative reconstitution of cellular membrane processes with Giant Suspended Bilayers.Sci Rep. 2019 May 10;9(1):7255. doi: 10.1038/s41598-019-43561-4. Sci Rep. 2019. PMID: 31076583 Free PMC article.
-
Phase Behavior of Charged Vesicles Under Symmetric and Asymmetric Solution Conditions Monitored with Fluorescence Microscopy.J Vis Exp. 2017 Oct 24;(128):56034. doi: 10.3791/56034. J Vis Exp. 2017. PMID: 29155700 Free PMC article.
-
Manipulation and Localized Deposition of Particle Groups with Modulated Electric Fields.Micromachines (Basel). 2020 Feb 23;11(2):226. doi: 10.3390/mi11020226. Micromachines (Basel). 2020. PMID: 32102176 Free PMC article.
References
-
- Simons, K., and D. Toomre. 2000. Lipid rafts and signal transduction. Nat. Rev. Mol. Cell Biol. 1:31–39. - PubMed
-
- Simons, K., and E. Ikonen. 1997. Functional rafts in cell membranes. Nature. 387:569–572. - PubMed
-
- Edidin, M. 1997. Lipid microdomains in cell surface membranes. Curr. Opin. Struct. Biol. 7:528–532. - PubMed
-
- London, E. 2002. Insights into lipid raft structure and formation from experiments in model membranes. Curr. Opin. Struct. Biol. 12:480–486. - PubMed
-
- Magde, D., E. L. Elson, and W. W. Webb. 1974. Fluorescence correlation spectroscopy. II. Experimental realization. Biopolymers. 13:29–61. - PubMed
Publication types
MeSH terms
Substances
Grants and funding
LinkOut - more resources
Full Text Sources
