

Co-release of noradrenaline and dopamine in the cerebral cortex elicited by single train and repeated train stimulation of the locus coeruleus
- PMID: 15865626
- PMCID: PMC1134661
- DOI: 10.1186/1471-2202-6-31
Co-release of noradrenaline and dopamine in the cerebral cortex elicited by single train and repeated train stimulation of the locus coeruleus
Abstract
Background: Previous studies by our group suggest that extracellular dopamine (DA) and noradrenaline (NA) may be co-released from noradrenergic nerve terminals in the cerebral cortex. We recently demonstrated that the concomitant release of DA and NA could be elicited in the cerebral cortex by electrical stimulation of the locus coeruleus (LC). This study analyses the effect of both single train and repeated electrical stimulation of LC on NA and DA release in the medial prefrontal cortex (mPFC), occipital cortex (Occ), and caudate nucleus. To rule out possible stressful effects of electrical stimulation, experiments were performed on chloral hydrate anaesthetised rats.
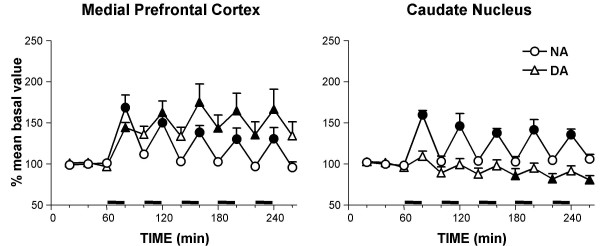
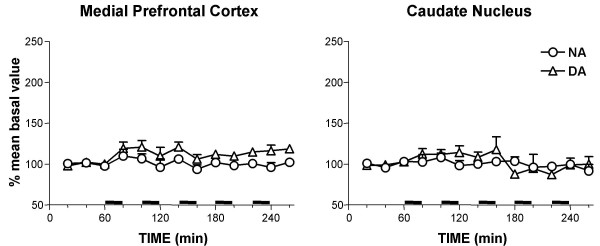
Results: Twenty min electrical stimulation of the LC, with burst type pattern of pulses, increased NA and DA both in the mPFC and in the Occ. NA in both cortices and DA in the mPFC returned to baseline within 20 min after the end of the stimulation period, while DA in the Occ reached a maximum increase during 20 min post-stimulation and remained higher than baseline values at 220 min post-stimulation. Local perfusion with tetrodotoxin (TTX, 10 microM) markedly reduced baseline NA and DA in the mPFC and Occ and totally suppressed the effect of electrical stimulation in both areas. A sequence of five 20 min stimulations at 20 min intervals were delivered to the LC. Each stimulus increased NA to the same extent and duration as the first stimulus, whereas DA remained elevated at the time next stimulus was delivered, so that baseline DA progressively increased in the mPFC and Occ to reach about 130 and 200% the initial level, respectively. In the presence of the NA transport (NAT) blocker desipramine (DMI, 100 microM), multiple LC stimulation still increased extracellular NA and DA levels. Electrical stimulation of the LC increased NA levels in the homolateral caudate nucleus, but failed to modify DA level.
Conclusion: The results confirm and extend that LC stimulation induces a concomitant release of DA and NA in the mPFC and Occ. The different time-course of LC-induced elevation of DA and NA suggests that their co-release may be differentially controlled.
Figures


Similar articles
-
Origin of extracellular dopamine from dopamine and noradrenaline neurons in the medial prefrontal and occipital cortex.Synapse. 2003 Dec 1;50(3):200-5. doi: 10.1002/syn.10264. Synapse. 2003. PMID: 14515337
-
Stimulation of the locus coeruleus elicits noradrenaline and dopamine release in the medial prefrontal and parietal cortex.J Neurochem. 2005 Jan;92(2):368-74. doi: 10.1111/j.1471-4159.2004.02866.x. J Neurochem. 2005. PMID: 15663484
-
Co-release of noradrenaline and dopamine in the prefrontal cortex after acute morphine and during morphine withdrawal.Psychopharmacology (Berl). 2002 Mar;160(2):220-4. doi: 10.1007/s00213-001-0985-y. Epub 2001 Dec 20. Psychopharmacology (Berl). 2002. PMID: 11875641
-
[The production and coexistence of neurotransmitters in the neurons of the rat's locus coeruleus].Kaibogaku Zasshi. 1999 Dec;74(6):591-601. Kaibogaku Zasshi. 1999. PMID: 10659576 Review. Japanese.
-
[Plasticity of central monoaminergic systems during aging].Nihon Shinkei Seishin Yakurigaku Zasshi. 2005 Feb;25(1):43-8. Nihon Shinkei Seishin Yakurigaku Zasshi. 2005. PMID: 15796070 Review. Japanese.
Cited by
-
Locus Coeruleus-Dorsolateral Septum Projections Modulate Depression-Like Behaviors via BDNF But Not Norepinephrine.Adv Sci (Weinh). 2024 Mar;11(10):e2303503. doi: 10.1002/advs.202303503. Epub 2023 Dec 28. Adv Sci (Weinh). 2024. PMID: 38155473 Free PMC article.
-
L-DOPA in Parkinson's Disease: Looking at the "False" Neurotransmitters and Their Meaning.Int J Mol Sci. 2019 Dec 31;21(1):294. doi: 10.3390/ijms21010294. Int J Mol Sci. 2019. PMID: 31906250 Free PMC article. Review.
-
Locus Coeruleus Dysfunction and Trigeminal Mesencephalic Nucleus Degeneration: A Cue for Periodontal Infection Mediated Damage in Alzheimer's Disease?Int J Environ Res Public Health. 2023 Jan 5;20(2):1007. doi: 10.3390/ijerph20021007. Int J Environ Res Public Health. 2023. PMID: 36673763 Free PMC article. Review.
-
Spatial contextual recognition memory updating is modulated by dopamine release in the dorsal hippocampus from the locus coeruleus.Proc Natl Acad Sci U S A. 2022 Dec 6;119(49):e2208254119. doi: 10.1073/pnas.2208254119. Epub 2022 Nov 29. Proc Natl Acad Sci U S A. 2022. PMID: 36442129 Free PMC article.
-
Noradrenergic regulation of cue-guided decision making and impulsivity is doubly dissociable across frontal brain regions.Psychopharmacology (Berl). 2024 Apr;241(4):767-783. doi: 10.1007/s00213-023-06508-2. Epub 2023 Nov 25. Psychopharmacology (Berl). 2024. PMID: 38001266 Free PMC article.
References
-
- Martres MP, Bouthenet ML, Sales N, Sokoloff P, Schwartz JC. Widespread distribution of brain dopamine receptors evidenced with [125I]iodosulpiride, a highly selective ligand. Science. 1985;228:752–755. - PubMed
Publication types
MeSH terms
Substances
LinkOut - more resources
Full Text Sources
