. 2005 May;29(1):26-39.
doi: 10.1016/j.mcn.2004.12.008.

Transgenic inhibition of Nogo-66 receptor function allows axonal sprouting and improved locomotion after spinal injury

Affiliations

Transgenic inhibition of Nogo-66 receptor function allows axonal sprouting and improved locomotion after spinal injury

Shuxin Li et al. Mol Cell Neurosci. 2005 May.

Abstract

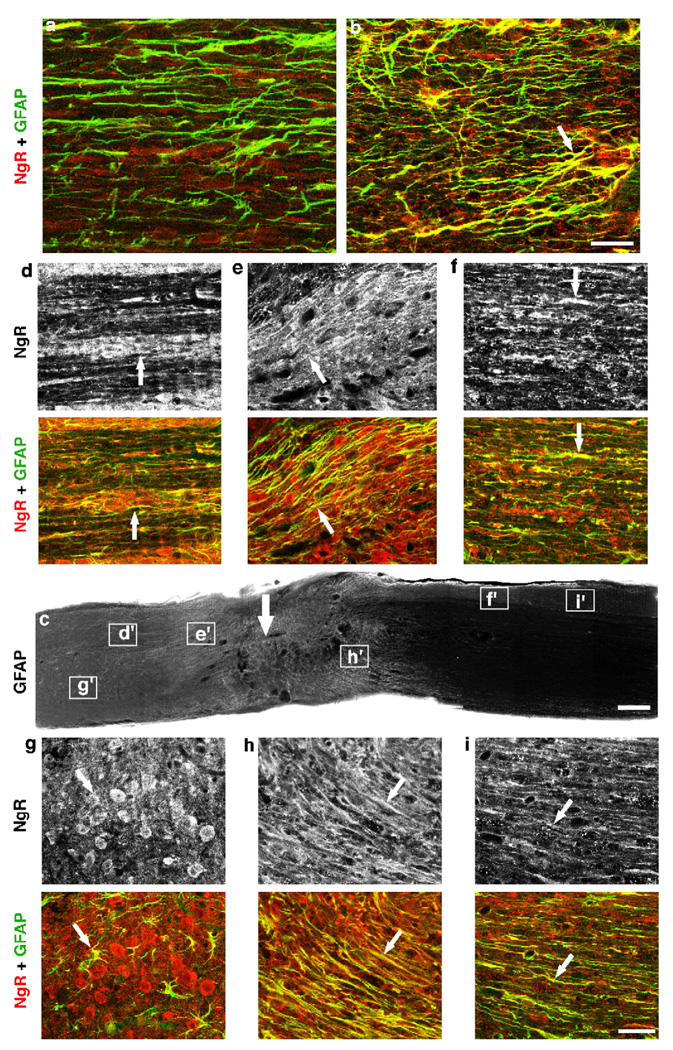
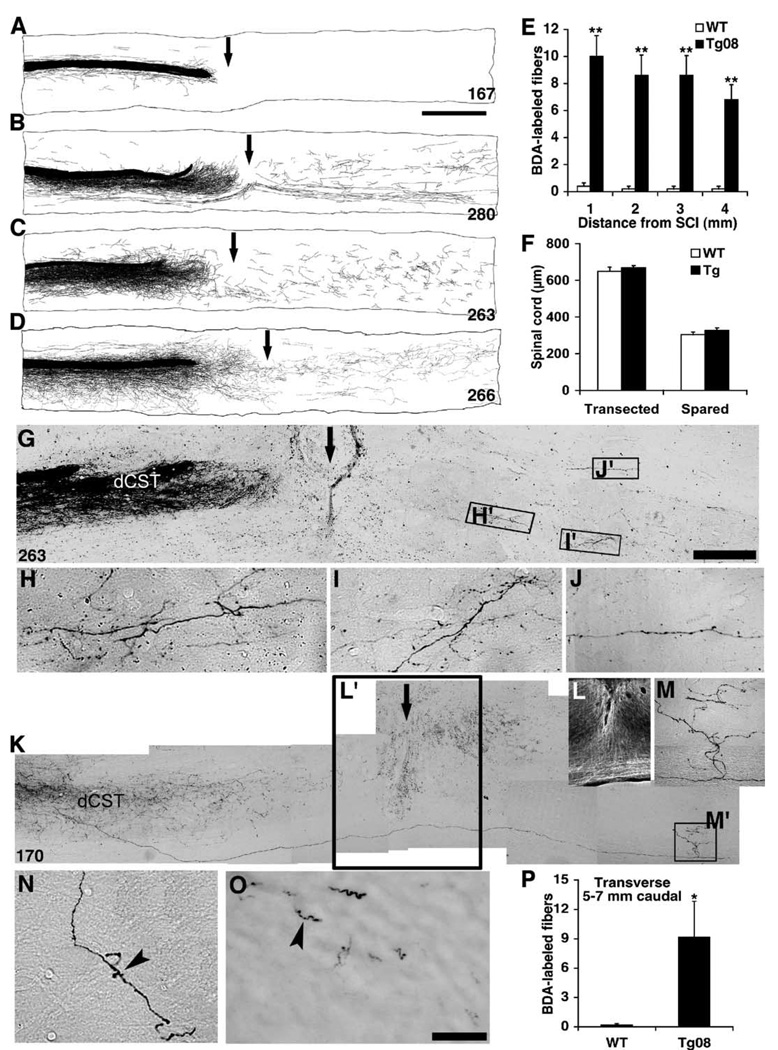
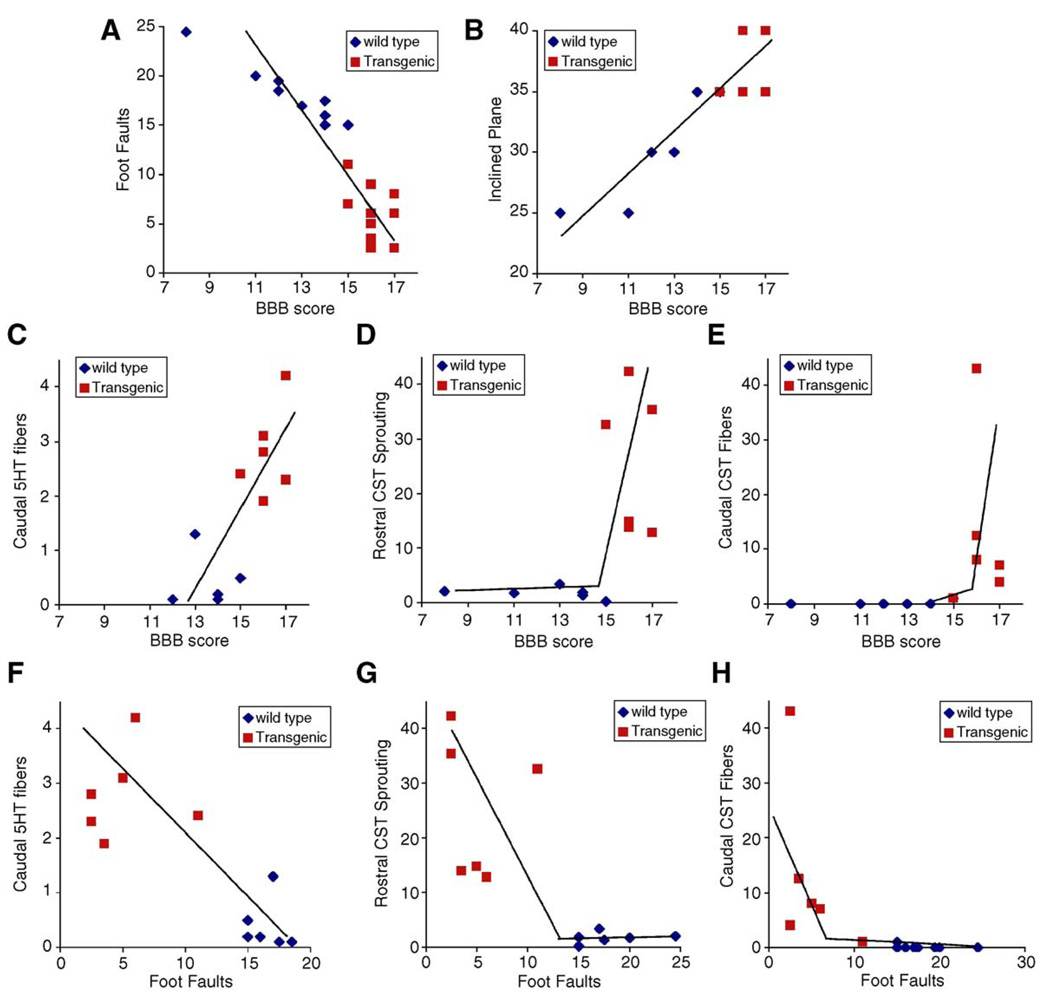
Axon growth after spinal injury is thought to be limited in part by myelin-derived proteins that act via the Nogo-66 Receptor (NgR). To test this hypothesis, we sought to study recovery from spinal cord injury (SCI) after inhibiting NgR transgenically with a soluble function-blocking NgR fragment. Glial fibrillary acidic protein (gfap) gene regulatory elements were used to generate mice that secrete NgR(310)ecto from astrocytes. After mid-thoracic dorsal over-hemisection injury, gfap::ngr(310)ecto mice exhibit enhanced raphespinal and corticospinal axonal sprouting into the lumbar spinal cord. Recovery of locomotion is improved in the gfap::ngr(310)ecto mice. These data indicate that the NgR ligands, Nogo-66, MAG, and OMgp, play a role in limiting axonal growth in the injured adult CNS and that NgR(310)ecto might provide a therapeutic means to promote recovery from SCI.


Figures

Fig. 1
Fig. 1
Expression of a general NgR antagonist after CNS injury in transgenic mice. (A) Schematic of WT NgR and the NgR cassette for transgenic mouse production. SS, signal sequence; LRR, leucine-rich Repeat; LRRNT, LRR amino terminal cysteine-rich region; LRRCT, LRR carboxyl terminal cysteine-rich region; TM/GPI, transmembrane/glycophosphatidylinositol anchorage site; gfap, glial fibrillary acidic protein. (B) Immunoblot analysis demonstrates the expression of NgR(310)ecto protein in cortex, spinal cord, and injured spinal cord. The secreted NgR(310)-ecto protein of 37 kDa in cortex (CTX) and spinal cord (SC) is seen in transgenic mice from both Line 08 and Line 01, but not in wild-type (WT) mice. There are no differences in the expression of 81 kDa membrane-associated endogenous NgR between WT and transgenic mice. After SCI, the soluble NgR(310)ecto level is increased in injured spinal cord compared with uninjured SC in transgenic mice. The densitometric measurements of the immunoblot optical density (arbitrary units) are displayed under each band. (C–H) Cortical sections double stained for NgR and GFAP near an injury area display a higher diffuse signal for NgR in transgenic mice (F) than in WT mice (C) consistent with secreted NgR. NgR staining is also co-localized with astrocytic marker GFAP in transgenic mice (arrows). Neuronal cell body NgR is detected in both WT and transgenic samples (*). (I and J) Sagittal spinal cord sections double staining for NgR and GFAP around over-hemisection display the stronger staining for NgR ecto in transgenic mice (J) than in WT mice (I) and the NgR staining is partly co-localized with astrocytes (J). Scale bar: 50 µm (C–J).
Fig. 2
Fig. 2
Distribution of NgR(310)ecto in the injured spinal cord of transgenic mice. (a and b) Parasagittal sections double stained for NgR and GFAP from uninjured mice display a higher signal for NgR in transgenic mice (b) than in WT mice (a). NgR staining is co-localized with astrocytic marker GFAP in transgenic mice (arrow), but not in wild-type mice. (c) Sagittal section from a spinal cord injured transgenic animal displays the increased GFAP signal at lesion areas, consistent with the upregulation of this protein in reactive astrocytes. (d–i) Higher magnification of several areas in c double stained with GFAP and NgR illustrates the high NgR signals (upper panels) at transected site, with maximal level at the center of lesion. NgR staining is co-localized with GFAP (arrows, lower panels) and is diffusely distributed in the extracellular space consistent with secreted protein. Scale bar: 50 µm (a and b), 250 µm (c); 50 µm (d–i).
Fig. 3
Fig. 3
Expression of Nogo A after spinal cord injury in NgR(310)ecto-transgenic mice. (A) Immunoblot analysis demonstrates the expression of Nogo A protein of 210 kDa in spinal cord and injured spinal cord. There are no differences in the expression of Nogo A protein after SCI. (B–E) Sagittal spinal cord sections stained for Nogo A (red) and GFAP (green) near a dorsal over-hemisection site illustrate the similar staining for Nogo A in white matter (arrow in B and D) and gray matter (arrow in C and E) for WT (B and C) and transgenic (D and E) mice. Nogo A staining of oligodendrocytic (B and D) and neuronal (C and E) cell bodies is seen in both WT and transgenic samples at a similar level. Scale bar: 25 µm (B and D); 50 µm (C and E).
Fig. 4
Fig. 4
CST sprouting rostral to SCI in NgR(310)ecto-transgenic mice. (A) Transverse sections rostral to lesion display a similar degree of dorsal CST labeling in both wild-type and NgR(310)ecto-transgenic mice. These transverse sections were obtained 5 mm rostral to a dorsal over-hemisection site from eight wild-type (WT) mice and 16 transgenic gfapngr-ecto mice as indicated. The midline is to the left and dorsal is up in all sections. Also note the increased density of ectopic sprouts lateral to the dCST in the transgenic animals. The bottom row illustrates the dCST pattern at the same level of the spinal cord in transgenic mice without spinal injury. Note that there is little dCST sprouting, similar to the injured control and distinct from the injured transgenic mice. Mouse identifying number is at the bottom right of each panel. (B) Schematic of transverse spinal cord section illustrating the dCST and the location of the high magnification images in C and D. (C and D) BDA-labeled CST fiber in gray matter adjacent to the dCST from a wild-type mouse (C) and gfapNgR(310)ecto mouse (D). (E) Ectopic CST fibers outside of the dCST and dlCST and ≥100 µm in length are counted from transverse sections 5–7 mm rostral to over-hemisection. Means ± SEM are reported from 7 to 9 determinations. The indicated values in the presence of the inhibitor were statistically different from control binding without inhibitor (**P ≤ 0.01; Student’s t test).
Fig. 5
Fig. 5
Transgenic NgR(310)ecto induces CST fiber growth in the caudal spinal cord. (A–D) Camera lucida reconstructions of all consecutive parasagittal sections around the lesion site. The injury site is indicated with an arrow. WT animals show no axons in the caudal cord (A). In contrast, soluble NgR(310)ecto induces a high density of sprouting from lesioned dorsal CST fibers (B–D). A subset of CST fibers project into caudal spinal cord, particularly into gray matter areas. Mouse identifying number is at the bottom right of each panel. (E) Quantification of CST fibers (total number of fibers per animal) is illustrated at various distances caudal to the injury site from transgenic (n = 6 mice) and WT (n = 6 mice) groups. (F) Dorsal–ventral linear measurements of lesioned spinal cord from parasagittal sections demonstrate a similar degree of transected and spared tissue at the injury site from wild-type and transgenic mice (n = 6 in each group). (G–J) Parasagittal section containing the transection site (arrow) from an NgR(310) ecto-transgenic animal illustrates the transection of BDA-labeled dCST fibers and some branched, sprouting fibers around transection site. Higher magnification of these areas in H′, I′, and J′ displays the meandering course of the sprouting CST fibers in both the gray matter (H and I) and white matter area (J). (K–M) Composite parasagittal sections around the lesion site (arrow) from an NgR(310)ecto-transgenic animal demonstrate a BDA-labeled regenerating axon from the transected rostral dCST bypassing the transection area and projecting into the caudal spinal cord gray matter (M). Immunostaining with GFAP displays the transection injury in this mouse (L). (N and O) Transverse sections at a level 5–7 mm caudal to the lesion illustrate some CST fibers with branching patterns in the gray matter (N) and white matter (O) of spinal cord. (P) CST fiber counts (number of fibers/section) at a level of 5–7 mm caudal to the lesion from transverse sections indicate a greater number in transgenic group (n = 7 mice) than in control group (n = 7 mice). Means ± SEM are reported. The values from transgenic mice are statistically different from the WT mice (*P < 0.05; **P < 0.01; Student’s t test). Scale bar, 1 mm (A–D, L); 250 µm (G and K); 25 µm (H–J, M–O).
Fig. 6
Fig. 6
Serotoninergic fiber sprouting in NgR(310)ecto-transgenic mice. (A–E) Parasagittal spinal cord sections from WT group double immunostained with anti-5-HT (red) and anti-GFAP (green) antibodies illustrate a large number of serotonin fibers (A–C, white arrow) rostral to the lesion (black arrow), but only few serotonin fibers are seen at the cord caudal to SCI (A, D, E). (F–J) Longitudinal sections from transgenic mice display a high density of serotonin fibers (white arrows) in both the rostral (F–H) and caudal spinal cord (F, I, J) to SCI. (K–L) Transverse spinal cord sections 5–7 mm distal to transection immunostained with anti-5-HT antibodies exhibit only a few serotonin fibers in ventral horn from WT mice (K), but a large number of 5-HT fibers are observed in the ventral horn from transgenic mice (L). (M) Immunoreactive serotonin fiber length in the ventral horn per transverse section at a level 5–7 mm rostral or 5–7 mm caudal to injury site was measured (n = 7 mice in each group). Means ± SEM are reported. The values from transgenic group are statistically different from the WT mice (**P < 0.01; Student’s t test). Scale bar, 1 mm (A, F); 25 µm (B–E, G–L).
Fig. 7
Fig. 7
Behavioral recovery from SCI in gfapNgR(310)ecto-transgenic mice. (A and B) Locomotor BBB score is reported as a function of time after dorsal over-hemisection in mice injured at 2 months of age (A) from WT (n = 9 mice), Line 08 (n = 9) or Line 01 (n = 7) or mice injured at 4–6 months of age (B; WT, n = 8; Tg, n = 11). For the specific mice in which tissue sparing was measured in Fig. 5F, the results were indistinguishable. For example, the 21-day BBB wild-type score was 12.2 ± 0.9 and the Tg08 score was 16.2 ± 0.2 (P < 0.01). (C) The maximal tolerated inclined plane angle is plotted as a function of time after SCI for WT (n = 9 mice) and transgenic (n = 9 mice) animals injured at 2 months of age. (D) Hindlimb errors during inclined grid climbing are reported as a function of post-SCI time from both groups (n = 9 mice in each group, age 2 months). In all the graphs, means ± SEM are reported. The values from transgenic group are statistically different from the WT mice (**P < 0.01; Student’s t test).
Fig. 8
Fig. 8
Correlation between anatomical and behavioral outcomes. (A and B) Behavioral scores from the experiments in Figs. 7A, C, and D are plotted against one another with each point representing the data from one mouse of the indicated genotype at 21 days post-SCI. (C–H) Axonal measurements of caudal 5HT fiber length from Fig. 6M or rostral CST sprouting density from Fig. 4E or caudal CST fiber counts from Fig. 5P are plotted against BBB scores from Fig. 7A or grid climbing errors from Fig. 7D on a mouse-by-mouse basis. Behavioral scores are from 21 days post-SCI.
Fig. 9
Fig. 9
Gait analysis after SCI in gfapNgR(310)ecto-transgenic mice. (A–D) Gait was imaged from below animals walking on a transparent treadmill belt moving at a speed of 25 cm/s. Uninjured mice (A), wild-type injured mice (B), or NgR(310)ecto-transgenic mice (C and D). Paw area in contact with the treadmill surface is plotted as a function of time for each paw. Records were obtained 4 weeks after SCI from 4- to 6-month-old female mice. (E) The fraction of injured mice of the indicated genotypes able to walk at 25 cm/s is plotted. Wild-type, n = 8; NgR(310)ecto-transgenic (TG), n = 11. (F) The average stride length calculated from all four paws for the genotypes and injury status is plotted. Data are collected from records as in A–D. The wild-type injury data are from the 3 of 8 mice able to walk at 25 cm/s and the transgenic data are from 11 mice. (G) The average variability in forelimb stride length is plotted for the indicated groups of mice. Means ± SEM are reported. *P < 0.05; Student’s t test.

Similar articles

Cited by

References

    1. Bareyre FM, Kerschensteiner M, Raineteau O, Mettenleiter TC, Weinmann O, Schwab ME. The injured spinal cord spontaneously forms a new intraspinal circuit in adult rats. Nat Neurosci. 2004;7:269–277. - PubMed
    1. Barton WA, Liu BP, Tzvetkova D, Jeffrey PD, Fournier AE, Sah D, Cate R, Strittmatter SM, Nikolov DB. Structure and Axon Outgrowth Inhibitor Binding of the Nogo-66 Receptor and Related Proteins. EMBO J. 2003;22:3291–3302. - PMC - PubMed
    1. Bartsch U, Bandtlow CE, Schnell L, Bartsch S, Spillmann AA, Rubin BP, Hillenbrand R, Montag D, Schwab ME, Schachner M. Lack of evidence that myelin-associated glycoprotein is a major inhibitor of axonal regeneration in the CNS. Neuron. 1995;15:1375–1381. - PubMed
    1. Basso DM, Beattie MS, Bresnahan JC, Anderson DK, Faden AI, Gruner JA, Holford TR, Hsu CY, Noble LJ, Nockels R, Perot PL, Salzman SK, Young W. MASCIS evaluation of open field locomotor scores: effects of experience and teamwork on reliability. Multicenter animal spinal cord injury study. J. Neurotrauma. 1996;13:343–359. - PubMed
    1. Benfey M, Aguayo AJ. Extensive elongation of axons from rat brain into peripheral nerve grafts. Nature. 1982;296:150–152. - PubMed

Publication types