. 2005 May 9;169(3):405-13.
doi: 10.1083/jcb.200411013. Epub 2005 May 2.

Mnt-Max to Myc-Max complex switching regulates cell cycle entry

Affiliations

Mnt-Max to Myc-Max complex switching regulates cell cycle entry

William Walker et al. J Cell Biol. .

Abstract

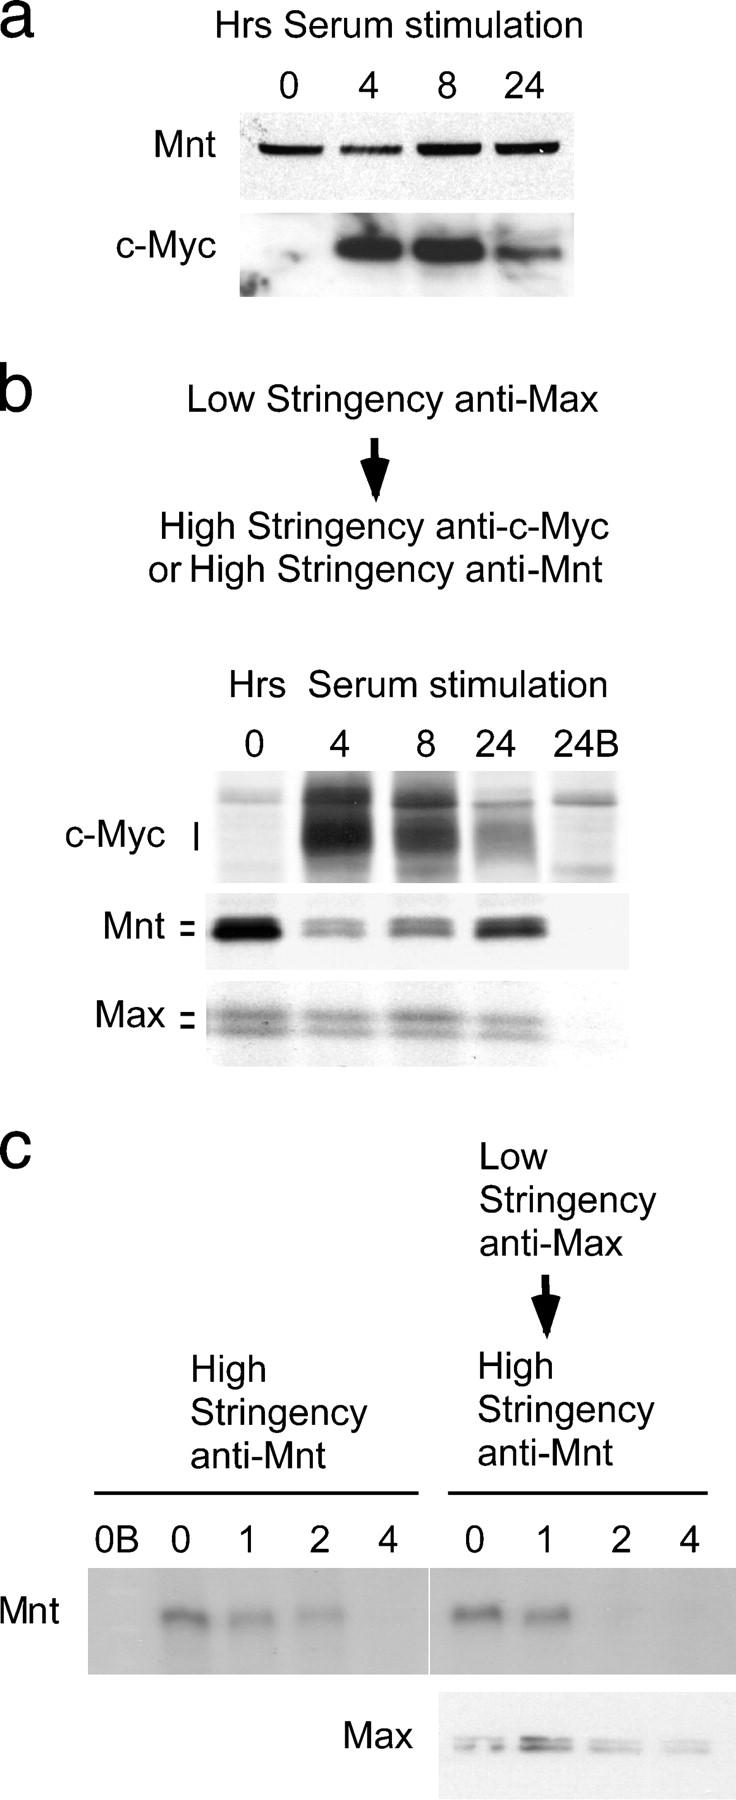
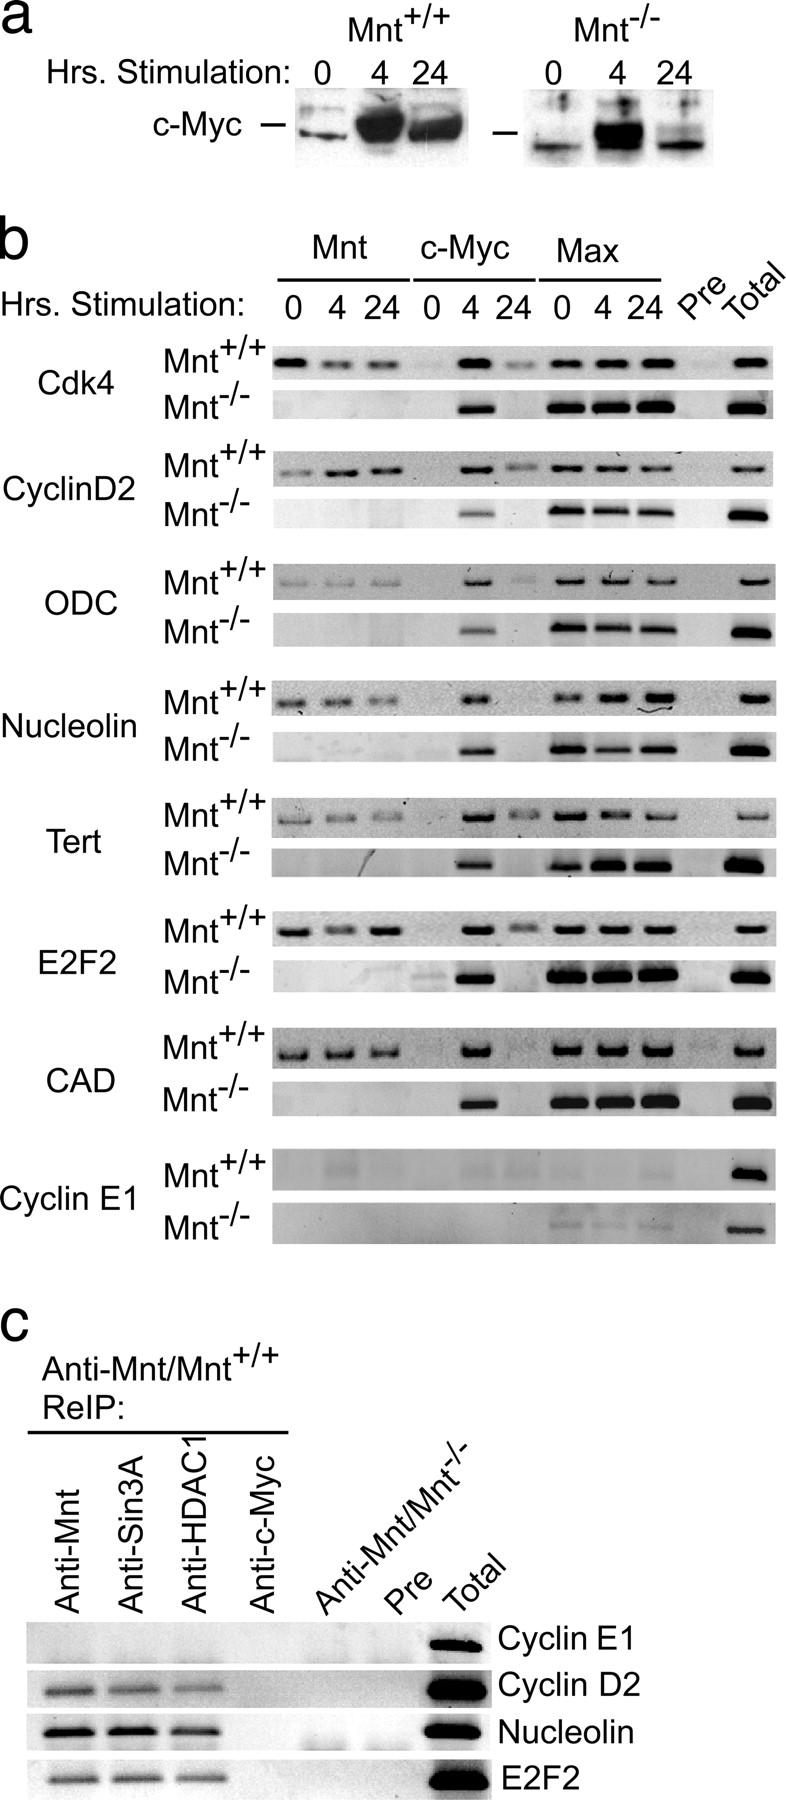
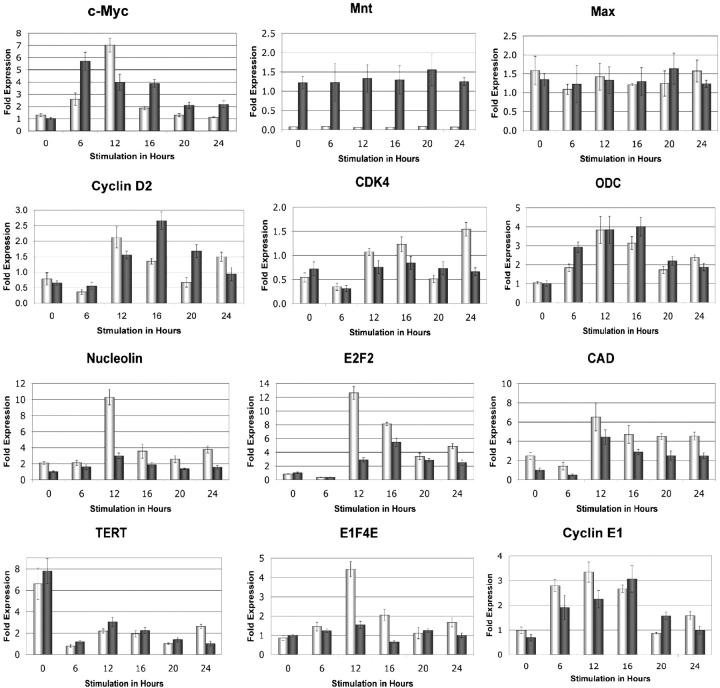
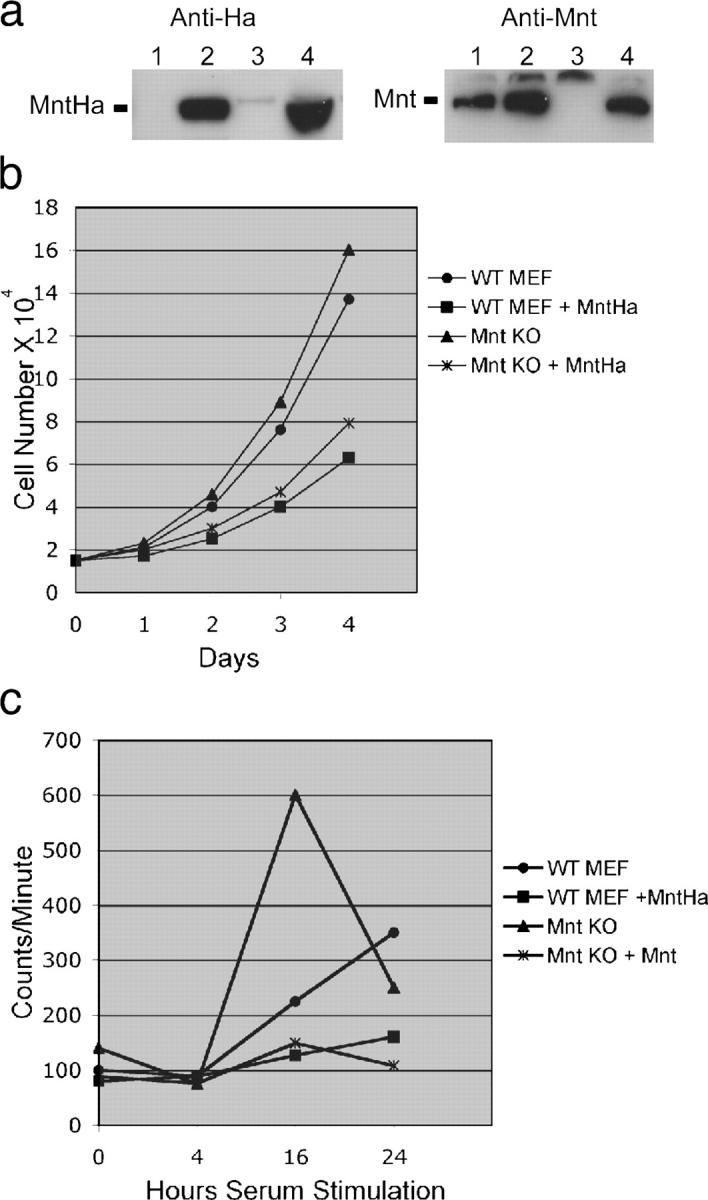
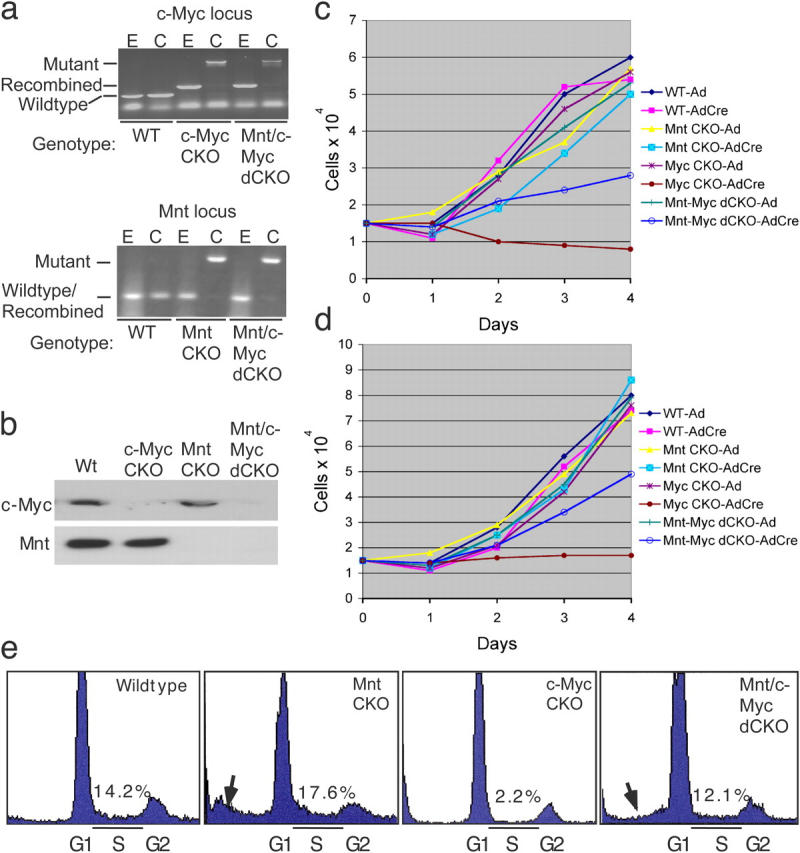
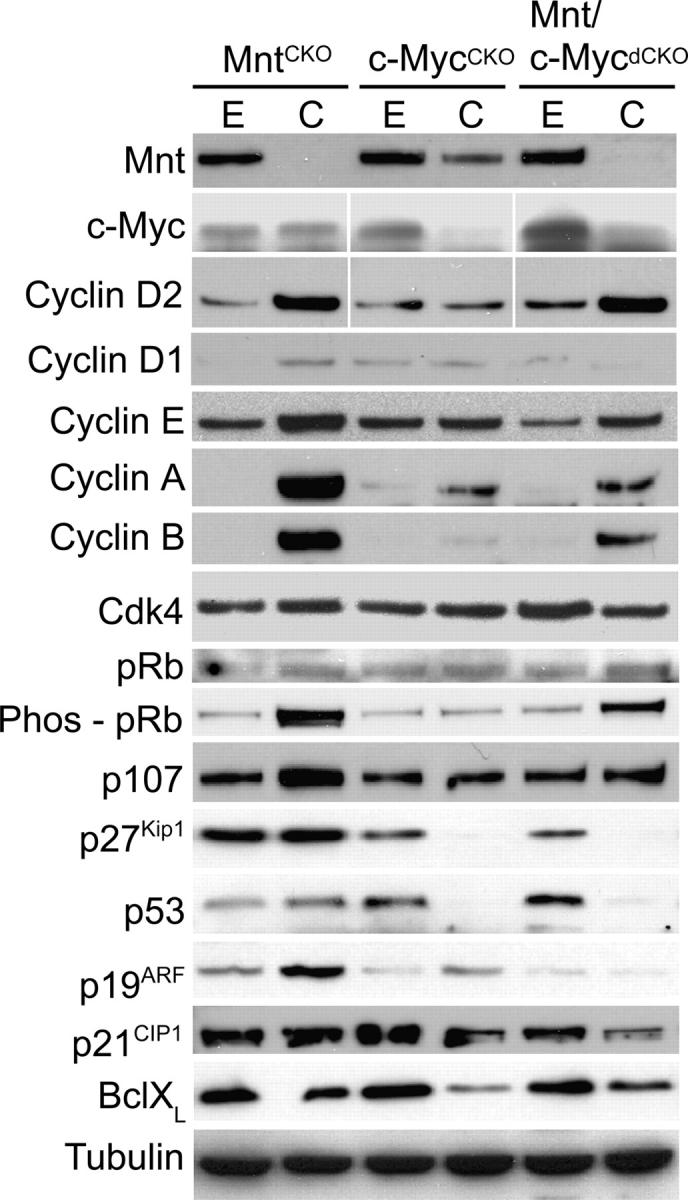
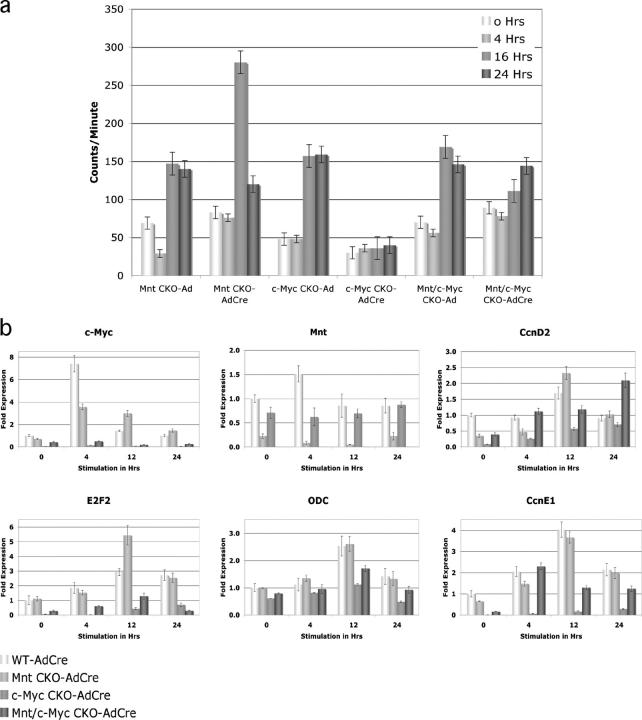
The c-Myc oncoprotein is strongly induced during the G0 to S-phase transition and is an important regulator of cell cycle entry. In contrast to c-Myc, the putative Myc antagonist Mnt is maintained at a constant level during cell cycle entry. Mnt and Myc require interaction with Max for specific DNA binding at E-box sites, but have opposing transcriptional activities. Here, we show that c-Myc induction during cell cycle entry leads to a transient decrease in Mnt-Max complexes and a transient switch in the ratio of Mnt-Max to c-Myc-Max on shared target genes. Mnt overexpression suppressed cell cycle entry and cell proliferation, suggesting that the ratio of Mnt-Max to c-Myc-Max is critical for cell cycle entry. Furthermore, simultaneous Cre-Lox mediated deletion of Mnt and c-Myc in mouse embryo fibroblasts rescued the cell cycle entry and proliferative block caused by c-Myc ablation alone. These results demonstrate that Mnt-Myc antagonism plays a fundamental role in regulating cell cycle entry and proliferation.


Figures

Figure 1.
Figure 1.
Complex switching between Mnt–Max and c-Myc–Max during cell cycle entry. (a) Western blot showing Mnt and c-Myc levels at 0, 4, 8, and 24 h after serum stimulation of quiescent MEFs. (b) Levels of Mnt and c-Myc found in low stringency anti-Max immunoprecipitations during cell cycle entry. Note reduction in Mnt (and Mnt–Max complexes) at times of high c-Myc levels. (c) Pulse-chase analysis of Mnt turnover when complexed to Max. Cells were metabolically labeled with medium containing [35S]methionine (pulse) then “chased” with medium containing unlabeled methionine. Mnt was immunoprecipitated under high stringency conditions (representing total Mnt) or from low stringency Max immunoprecipitated material at 0, 1, 2, and 4 h, as indicated, during the chase period. B, immunogen blocked antibody.
Figure 2.
Figure 2.
Mnt–Max and Myc–Max complex switching on shared target genes. (a) Western blot showing c-Myc expression in wild-type (Mnt+/+) and Mnt null (Mnt−/−) MEFs at 0, 4, and 24 h after serum stimulation of quiescent cells. (b) ChIP analysis, performed in parallel with the Western blot shown in panel a, examining Mnt, c-Myc, and Max binding to specific E-box–containing regions in the Cdk4, Cyclin D2, ODC, Nucleolin, Telomerase (Tert) E2F2, CAD, and Cyclin E1 genes at 0, 4, and 24 h after serum stimulation. (c) Chromatin reimmunoprecipitation (ReIP) assays showing the presence of Sin3A and HDAC1 at several Mnt-Myc target genes. Pre, preimmune serum; Total, total input.
Figure 3.
Figure 3.
Regulation of c-Myc/Mnt target genes during cell cycle entry in the absence of Mnt. RNA from wild-type and Mnt null primary MEFs was harvested at the indicated times after serum stimulation and quantitative real-time RT-PCR assays performed in triplicate for the indicated genes. The data are representative of two or more independent experiments. RNA levels of the ARBP P0 gene, which do not change during cell cycle entry (not depicted), were used to standardize samples. Fold expression values were calculated relative to the 0-h time point in wild-type cells for each gene as previously described (Livak and Schmittgen, 2001). SDs are shown.
Figure 4.
Figure 4.
Mnt overexpression slows cell proliferation and impedes cell cycle entry. (a) Western blot showing expression of Ha-tagged Mnt (anti-Ha set) in pBabeMntHa-infected MEFs (lanes 2 and 4) and endogenous Mnt (anti-Mnt set) in MEFs infected with empty virus (lanes 1 and 3). (b) Proliferation curve conducted for 4 d showing decline in proliferation rate caused by Mnt overexpression in wild-type and Mnt null MEFs. Each value is the average number of cells counted from three different dishes in two separate experiments. (c) Analysis of cell cycle (S-phase) entry in wild-type and Mnt null MEFs overexpressing Mnt. Tritiated thymidine incorporation was measured at the indicated number of hours after serum stimulation of MEFs made quiescent by confluence arrest and serum starvation. Experiments were performed at least twice in triplicate and averages are shown.
Figure 5.
Figure 5.
Deletion of Mnt rescues proliferation arrest caused by loss of c-Myc. (a) PCR genotyping of MEFs of the indicated genotypes after infection with empty (E) adenovirus or Cre (C) recombinase-expressing adenovirus. Note the PCR primers used to detect deleted Mnt alleles do not discriminate from wild-type and recombined Mnt alleles. (b) Western blot examining Mnt and c-Myc expression after AdCre infection of the indicated genotypes. (c and d) MEF proliferation curves after deletion of Mnt, c-Myc, and Mnt plus c-Myc in primary MEFs (c) and immortal MEFs (d). Values shown in c and d are the average of cell counts obtained from triplicate plates and are representative of results obtained from two independent experiments. (e) Cell cycle profiles generated from FAC sorting of propidium iodide stained cells 48 h after AdCre infection of the indicated cell lines. % of cells in S-phase (S) is shown. Arrows highlight sub G1 (growth phase 1) fractions consistent with apoptosis.
Figure 6.
Figure 6.
Effect of acute Mnt, c-Myc, and Mnt plus c-Myc deletion on the expression levels of proteins involved in the regulation of cell proliferation. Cell extracts were obtained from primary MEFs after AdCre-mediated deletion of Mnt, c-Myc, or both Mnt and c-Myc as shown in Fig. 5 (a and b). Western blots were performed with antibodies against the indicated proteins.
Figure 7.
Figure 7.
Analysis of cell cycle (S-phase) entry after acute deletion of Mnt and Mnt plus c-Myc. (a) Tritiated thymidine incorporation (counts/minute) were determined at the indicated times after serum stimulation of immortal MEFs made quiescent by confluence arrest and serum deprivation. (b) Quantitative real-time RT-PCR analysis of Cyclin D2, E2F2, ODC, and Cyclin E1 gene expression after serum stimulation. Both tritiated thymidine and RT-PCR experiments were performed in triplicate and SDs are shown.

References

    1. Amati, B., S. Dalton, M.W. Brooks, T.D. Littlewood, G.I. Evan, and H. Land. 1992. Transcriptional activation by the human c-Myc oncoprotein in yeast requires interaction with Max. Nature. 359:423–426. - PubMed
    1. Askew, D.S., R.A. Ashmun, B.C. Simmons, and J.L. Cleveland. 1991. Constitutive c-myc expression in an IL-3-dependent myeloid cell line suppresses cell cycle arrest and accelerates apoptosis. Oncogene. 6:1915–1922. - PubMed
    1. Ayer, D.E. 1999. Histone deacetylases: transcriptional repression with SINers and NuRDs. Trends Cell Biol. 9:193–198. - PubMed
    1. Blackwood, E.M., and R.N. Eisenman. 1991. Max: a helix-loop-helix zipper protein that forms a sequence-specific DNA-binding complex with Myc. Science. 251:1211–1217. - PubMed
    1. Blackwood, E.M., B. Luscher, and R.N. Eisenman. 1992. Myc and Max associate in vivo. Genes Dev. 6:71–80. - PubMed

Publication types

MeSH terms

Substances