. 2005 May 9;169(3):435-45.
doi: 10.1083/jcb.200502019. Epub 2005 May 2.

STIM1, an essential and conserved component of store-operated Ca2+ channel function

Affiliations

STIM1, an essential and conserved component of store-operated Ca2+ channel function

Jack Roos et al. J Cell Biol. .

Abstract

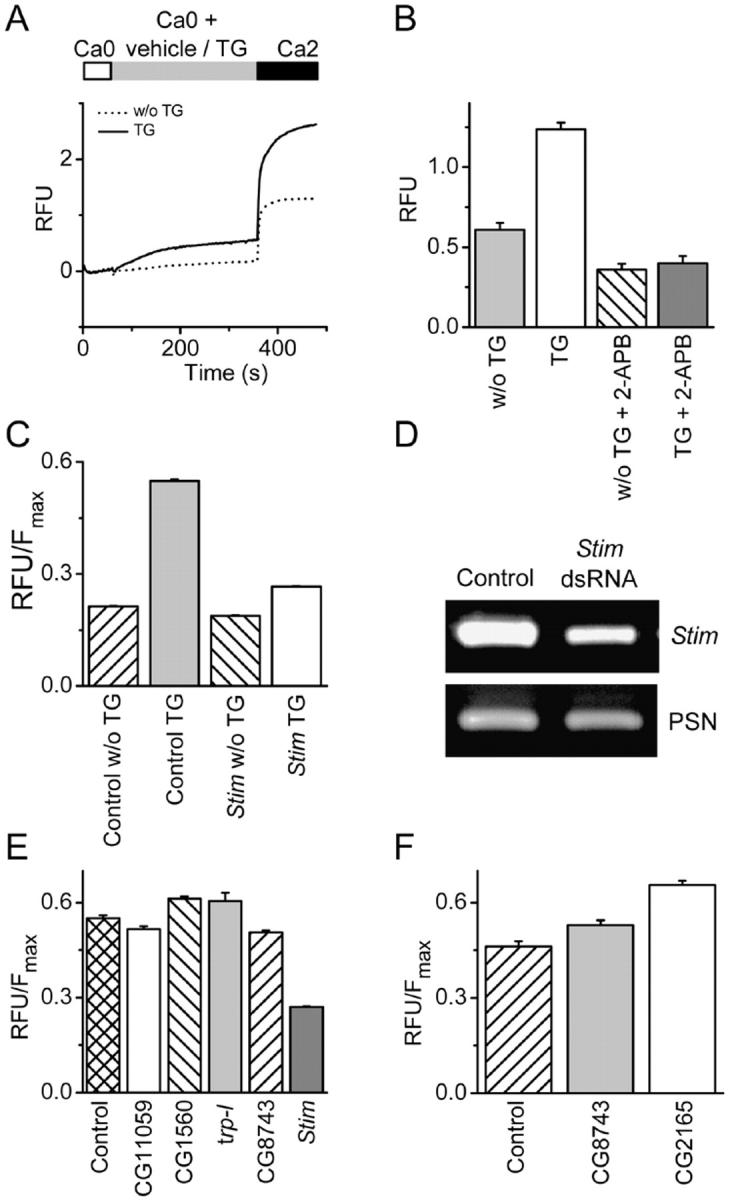
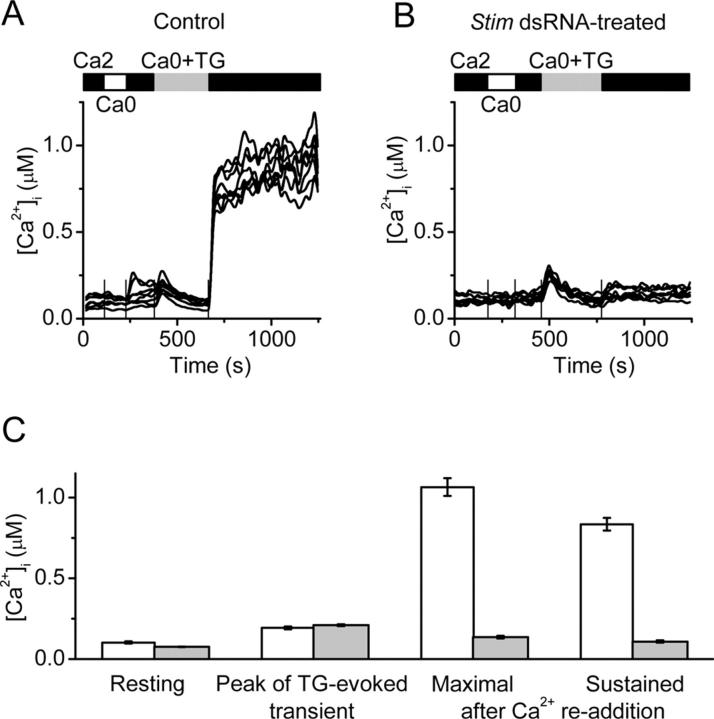
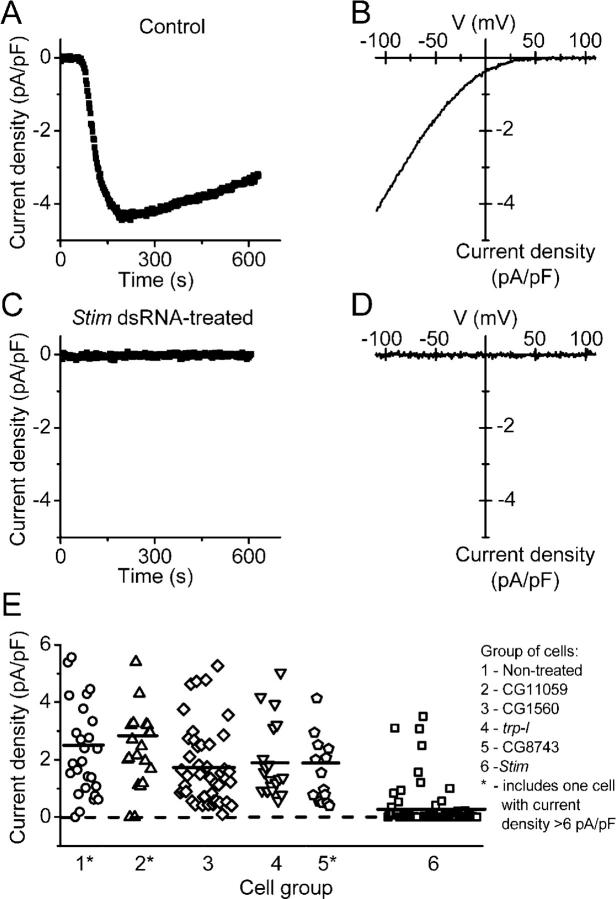
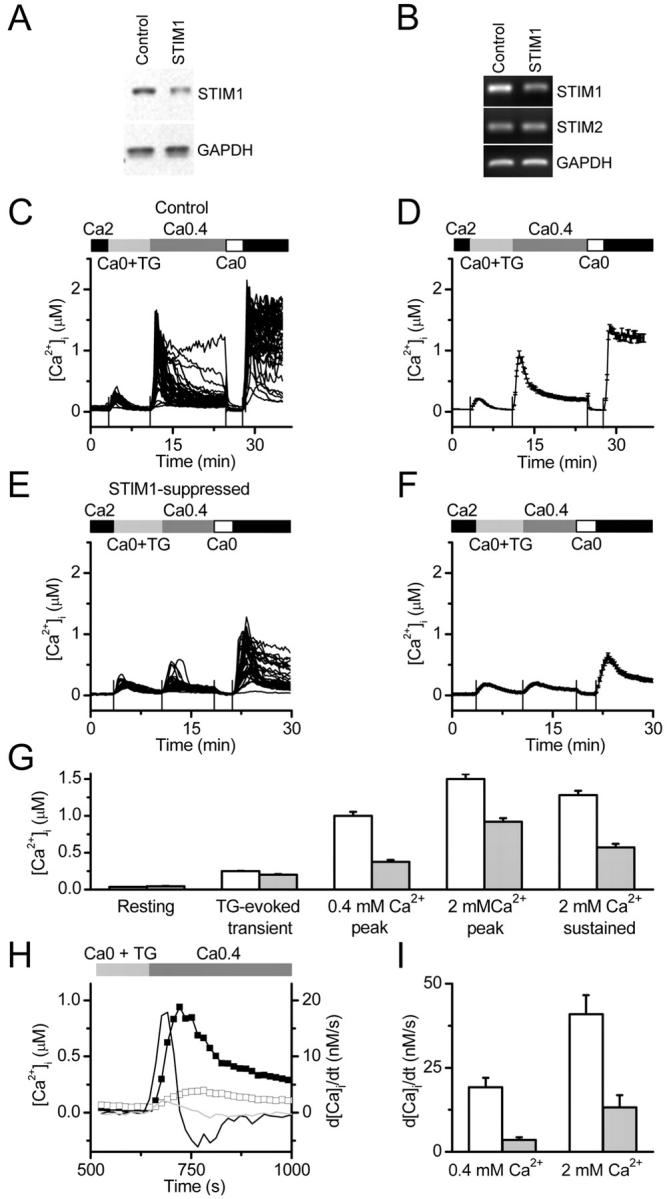
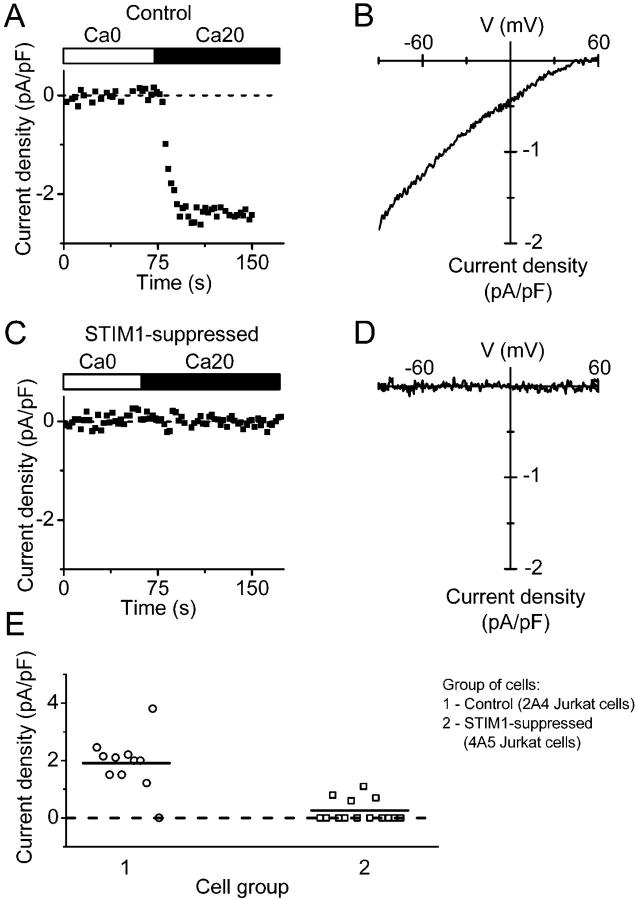
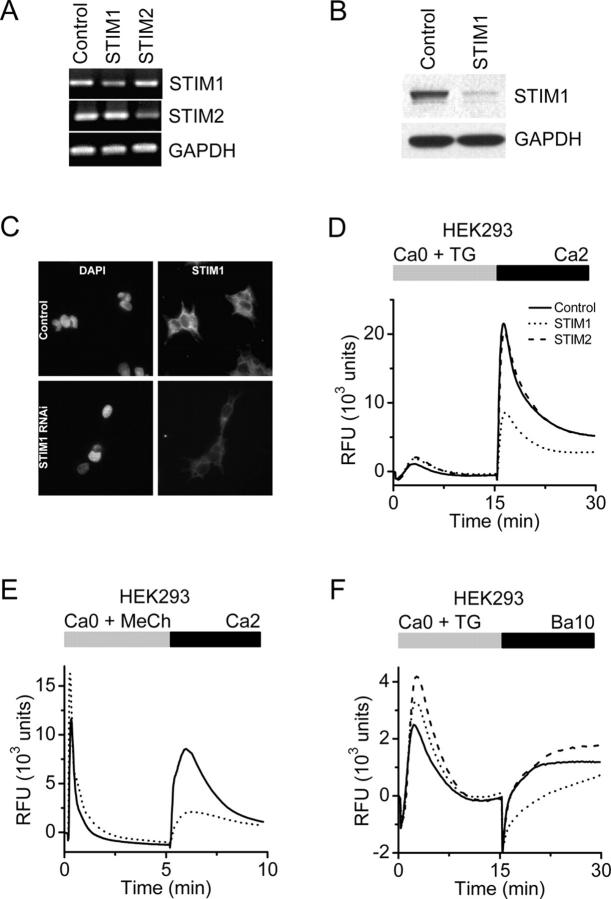
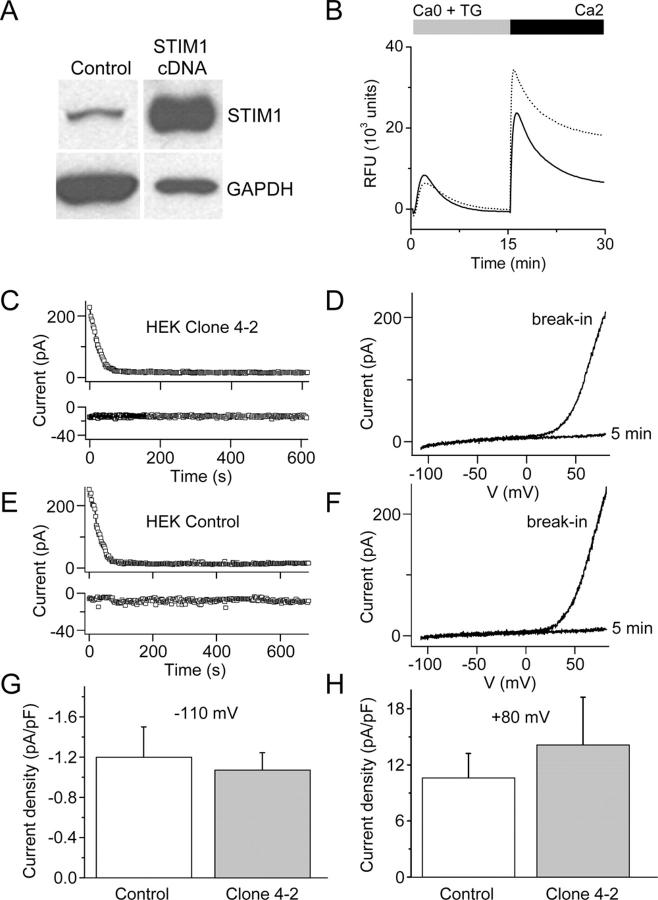
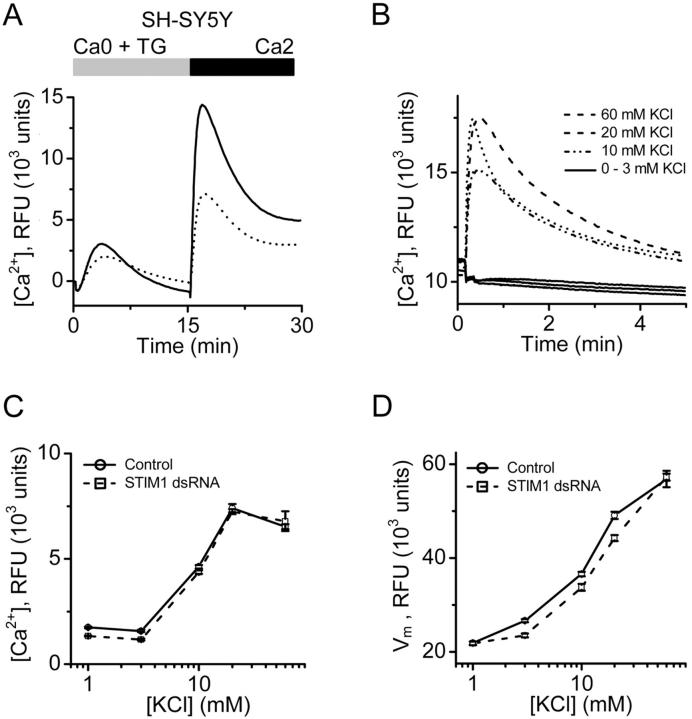
Store-operated Ca2+ (SOC) channels regulate many cellular processes, but the underlying molecular components are not well defined. Using an RNA interference (RNAi)-based screen to identify genes that alter thapsigargin (TG)-dependent Ca2+ entry, we discovered a required and conserved role of Stim in SOC influx. RNAi-mediated knockdown of Stim in Drosophila S2 cells significantly reduced TG-dependent Ca2+ entry. Patch-clamp recording revealed nearly complete suppression of the Drosophila Ca2+ release-activated Ca2+ (CRAC) current that has biophysical characteristics similar to CRAC current in human T cells. Similarly, knockdown of the human homologue STIM1 significantly reduced CRAC channel activity in Jurkat T cells. RNAi-mediated knockdown of STIM1 inhibited TG- or agonist-dependent Ca2+ entry in HEK293 or SH-SY5Y cells. Conversely, overexpression of STIM1 in HEK293 cells modestly enhanced TG-induced Ca2+ entry. We propose that STIM1, a ubiquitously expressed protein that is conserved from Drosophila to mammalian cells, plays an essential role in SOC influx and may be a common component of SOC and CRAC channels.


Figures

Figure 1.
Figure 1.
Essential role of gene CG9126 (Stim) in SOC influx in Drosophila S2 cells. (A) Drosophila SOC influx measured in a fluorimeter. Basal-subtracted fluo-4 fluorescence in relative fluorescence units (RFUs) from Drosophila S2 cells in a 96-well plate. Cells were initially in Ca2+-free solution (Ca0). Bars indicate addition of TG (1 μM, solid line) or vehicle (dotted line), followed by 2 mM Ca2+ (Ca2). The TG-independent response can be explained by partial store depletion during exposure to Ca2+-free solution or possible damage to some cells. Traces are averages of recordings from four individual wells. (B) Development of an end point assay for screening gene candidates. Cells were treated as described in A and placed in a fluorimeter 3 min after adding 2 mM Ca2+. Pre-incubating cells with 20 μM 2-APB reduced TG-dependent Ca2+ entry significantly (P < 5 × 10⁻⁶: unpaired t test) and to a greater extent than the TG-independent Ca2+ entry (P < 5 × 10⁻⁶: unpaired t test); n = 24 for each treatment group. (C) Treatment of Drosophila S2 cells with Stim dsRNA inhibits SOC influx by 90% (P < 10−5; unpaired t test compared with control mock-treated cells). Data represent basal-subtracted RFUs divided by maximal fluorescence (Fmax) to normalize for cell number. The TG-dependent Ca2+ signal can be obtained by subtracting the average TG-independent signal from the Ca2+ signal after treatment with TG. Knockdown of Stim also inhibited the TG-independent Ca2+ signal (vehicle) by <10%, albeit significantly (P < 10−4, unpaired t test). (D) mRNA reduction in Stim dsRNA-treated cells. RNA was isolated from mock-treated cells or cells treated with a dsRNA specific to Stim. RT-PCR analysis was performed using gene-specific primers to Stim or to a control gene, presenilin (PSN). (E) Suppression of other candidate genes did not markedly inhibit TG-induced Ca2+ influx. Cells were mock treated or treated with dsRNA specific for CG11059, CG1560, trp-l, CG8743, or Stim for 5 d. Ca2+ influx was measured after pretreatment with TG. Data represent basal-subtracted RFUs divided by Fmax to normalize for cell number. (F) Knockdown of CG8743 or CG2165 elevates basal intracellular Ca2+ levels. Cells were mock treated (control) or treated with dsRNA specific for CG8743 or CG2165 for 5 d. Data represents basal RFUs divided by the maximum fluorescence, Fmax, to normalize to cell number (P < 0.01, one-way ANOVA, Dunnett's multiple comparison test compared with control mock-treated cells). (B, C, E, and F) Error bars represent means ± SD.
Figure 2.
Figure 2.
Suppression of Ca 2+ signal by Sti m dsRNA treatment. (A) [Ca2+]i in single cells treated with CG1560 dsRNA (control). Solution exchanges are indicated by solid (S2 Ringer with 2 mM Ca2+), open (Ca2+ free), and gray (Ca2+-free containing 1 μM TG) bars, respectively. Vertical lines indicate the time of solution exchange. (B) Intracellular Ca2+ responses in S2 cells treated with Stim dsRNA. (C) Averaged values ± SEM for control cells (n = 46 cells in two representative experiments, white bars) and Stim dsRNA-treated (n = 197 cells in three representative experiments, gray bars): resting [Ca2+]i; peak [Ca2+]i during the TG-evoked release transient; maximal and sustained (5 min) [Ca2+]i after readdition of 2 mM external Ca2+. The values of maximal [Ca2+]i and sustained [Ca2+]i in control and Stim suppressed cells are significantly different (P < 5 × 10⁻⁶).
Figure 3.
Figure 3.
Suppression of Drosophi la CRAC current by Stim dsRNA treatment. (A) Current development evaluated at −110 mV in selected control cell (untreated). Cells were bathed in S2 external solution with 2 mM Ca2+ and dialyzed with BAPTA-buffered S2 internal solution to induce store depletion passively. Whole-cell recording was initiated at time 0. (B) Leak-subtracted current-voltage relation of maximal Drosophila CRAC current recorded in the same control cell. (C) Typical Stim dsRNA-treated cell; current at −110 mV. (D) Leak-subtracted I-V relation 200 s after establishing the whole cell configuration. (E) CRAC current density in dsRNA-treated and untreated S2 cells. Each point represents CRAC current density (pA/pF) in a single cell, plotted in consecutive order from left to right within six groups of cells: untreated (circles, n = 27 cells in three experiments); cells treated with dsRNA to suppress CG11059 (triangles, n = 21 cells in three experiments); CG1560 (diamonds, n = 45 cells in six experiments); trp-l (inverted triangles, n = 20 cells in two experiments); CG8743 (pentahedrons, n = 16 cells in two experiments); or Stim (squares, n = 77 cells in eight experiments). Groups 1, 2, and 5 include one cell each with current density >6 pA/pF. Horizontal lines indicate the mean value of current density in each group.
Figure 4.
Figure 4.
The effect of STIM1 suppression on Ca 2+ signaling in individual Jurkat T cells. (A) Western blot of 4A5 cell lysates (lane 2), compared with control 2A4 cells (lane 1) showing >50% reduction in STIM1 protein, with no change in the protein levels of GAPDH. (B) The specificity of STIM1 suppression was confirmed by RT-PCR analysis showing a reduction in STIM1, but not STIM2 or GAPDH, mRNA levels in 4A5 cells (lane 2) compared with control 2A4 cells (lane 1). (C) Intracellular Ca2+ responses in 51 Jurkat 2A4 control cells. Cells were bathed in Jurkat Ringer (2 mM Ca2+), low-Ca2+ (0.4 mM) Jurkat Ringer, and Ca2+-free Jurkat Ringer with 1 μM TG, as indicated. The first peak is due to Ca2+ release from internal stores in the presence of TG. The second and third peaks result from Ca2+ entry through CRAC channels upon addition of 0.4 and 2 mM external Ca2+, respectively. Sustained [Ca2+]i was measured 5 min after readdition of 2 mM external Ca2+. (D) Averaged [Ca2+]i in control 2A4 cells from the same experiment. (E) Intracellular Ca2+ responses in 40 STIM1-suppressed 4A5 Jurkat cells. (F) Averaged [Ca2+]i in STIM1-suppressed 4A5 cells from the same experiment as in D. (G) Combined data from three control experiments (164 cells, white bars) and three experiments with STIM1-suppressed cells (141 cells, gray bars). Averaged values of peak and sustained [Ca2+]i are significantly different in STIM1-suppressed cells (P < 8 × 10⁻⁶, < 8 × 10⁻⁶, and < 2 × 10⁻⁵, respectively, by independent two populations t test). (H) Maximal rate of Ca2+ rise upon Ca2+ readdition as an estimate of Ca2+ influx. Representative averaged traces obtained in the same experiments as in A–D are shown (control 2A4 cells, closed squares; STIM1-suppressed 4A5 cells, open squares), along with corresponding differentiated [Ca2+]i traces, d[Ca2+]i/dt (right axis), for control 2A4 cells (black line without symbols) and STIM1-suppressed 4A5 cells (gray line). The peak derivatives correspond to the maximal rate of Ca2+ rise in nM. (I) STIM1 expression and d[Ca2+]i/dt. The maximal rate of [Ca2+]i rise after 0.4 mM or 2 mM Ca2+ readdition in control 2A4 cells (white bars: 164 cells in three experiments); and STIM1-suppressed 4A5 cells (gray bars: 141 cells in three experiments; P < 3 × 10⁻⁷ or < 2 × 10⁻⁷ for 0.4 and 2 mM Ca2+, respectively).
Figure 5.
Figure 5.
Reduction of Jurkat CRAC current by STIM1 suppression. (A) Current development in selected control 2A4 Jurkat cell. Cells were first bathed in Ca2+-free Jurkat external solution for 5 min and dialyzed with BAPTA-containing Jurkat internal solution. CRAC current was revealed after exchange of Ca2+-free Jurkat solution to 20 mM Ca2+ Jurkat external solution. Maximal current density was evaluated at −110 mV. (B) Leak-subtracted current-voltage relationship of fully developed CRAC current recorded in the same control 2A4 Jurkat cell. (C) Suppression of CRAC current in STIM1-suppressed 4A5 Jurkat cell. (D) Leak-subtracted I-V relationship in the same cell, as in C. (E) CRAC current density in control 2A4 cells (circles, n = 11) and STIM1-suppressed 4A5 cells (squares, n = 11). Horizontal lines indicate the mean value of current density in each group. (P < 3 × 10⁻⁶).
Figure 6.
Figure 6.
Suppression of STIM1 in HEK293 cells inhibits SOC influx. (A) RT-PCR analysis. STIM1 and STIM2 mRNA levels were reduced in cells transfected with the appropriate siRNA to <50% of control cells (transfected with scrambled siRNA). GAPDH levels were unchanged in either treatment group. (B) Western blot analysis. In cells transfected with the STIM1 siRNA, STIM1 protein levels were reduced to <10% of control levels, whereas GAPDH levels were unchanged. (C) Immunofluorescence localization of STIM1 in HEK293 cells. Nuclear staining pattern (left) with DAPI (Molecular Probes) in HEK293 cells treated with either a scrambled siRNA (top) or siRNA to STIM1 (bottom). No change in nuclear staining pattern or intensity was observed after RNAi-induced suppression of STIM1. STIM1-associated immunofluorescence (right) in HEK293 cells treated with either control (top) or STIM1 (bottom) siRNAs. In control cells, STIM1 has a diffuse reticulated localization pattern with some punctuate staining, which is consistent with expression associated with plasma membrane and ER. The intensity of STIM1 immunofluorescence was markedly decreased in the cells treated with STIM1 siRNA. (D) Calcium signals in HEK293 cells after RNAi-mediated knockdown. Suppression of STIM1 (dotted line) reduced SOC influx by 60% compared with control (solid line; P < 10−4, unpaired t test), whereas suppression of STIM2 (dashed line) had little effect. Data indicate RFUs in 384-well plates monitored in a FLIPR384 fluorimeter. The traces are from a representative experiment, and are averaged signals from 48 wells per group. Traces from cells treated with vehicle (DMSO) instead of TG were essentially flat (not depicted for clarity). (E) Calcium signals after muscarinic receptor activation. RT-PCR analysis revealed that the muscarinic receptor, subtype m3, is expressed in our HEK293 cells (not depicted). 300 μM of methylcholine evoked Ca2+-release transients in Ca2+-free buffer were not inhibited by STIM1 suppression, but SOC influx upon readdition of 2 mM Ca2+ was greatly reduced in STIM1 siRNA-treated cells (dotted line) compared with control cells (solid line). The apparent enhancement of the methylcholine-evoked Ca2+ release transient in the STIM1-suppressed cells was not a consistent finding. (F) TG-induced Ba2+ entry. The rate of TG-induced Ba2+ entry in STIM1-suppressed cells (dotted line) was significantly lower than in control cells (solid line) or STIM2-suppressed cells (dashed line; P < 10−4, unpaired t test).
Figure 7.
Figure 7.
Overexpression of STIM1 in HEK293 cells. (A) Western blot analysis of STIM1 (top band) and GAPDH (bottom band) proteins in HEK-STIM1 (STIM1 overexpressing) cells and control cells (HEK-Zeo cells); lane 1, 10 μg protein; lane 2, 1 μg protein. We estimate STIM1 protein levels to be nearly 100-fold greater than in the HEK-STIM1 cells compared with control cells. (B) Representative traces of TG-induced Ca2+ release and TG-induced Ca2+ entry in HEK-STIM1 cells (dotted line) compared with HEK-Zeo cells (solid line). TG-induced Ca2+ entry was enhanced in HEK-STIM1 cells by an average of 17% in four experiments. (C and E) Time course of outward current at +80 mV and inward current at −110 mV (note different scales) for control HEK-Zeo (E) and HEK-STIM1 cells (C). (D and F) Representative current-voltage relationships immediately after break-in to achieve whole-cell recording and 5 min later in control HEK-Zeo (D) and HEK-STIM1 cells (F). Outwardly rectifying Mg2+-inhibited cation current representing channel activity of TRPM7 disappeared as Mg2+ diffused into the cell from the pipette. (G and H) Inward and outward currents were not significantly altered by overexpression of STIM1; n = 10 cells for each group. Error bars represent SEM.
Figure 8.
Figure 8.
Specificity of STIM1 RNAi in SH-SY5Y cells. (A) Effects of STIM1 RNAi on SOC influx in SH-SY5Y cells. TG-dependent Ca2+ entry in STIM1 siRNA-treated cells (dotted line) is greatly reduced compared with control cells (solid line). Traces from cells treated with vehicle (DMSO) instead of TG were essentially flat (not depicted for clarity). (B) KCl-evoked Ca2+ signals as a measure of voltage-gated Ca2+ channel activity. Data presented as fluo-4 RFUs. At concentrations of 3 mM KCl or below, no significant change in cytosolic Ca2+ was observed. At 10, 20, and 60 mM KCl, a rapid rise in cytosolic Ca2+ was detected. (C) Maximal KCl-evoked RFU values are not different in control and STIM1-knockdown cells. (D) STIM1 suppression does not affect the resting membrane potential or the response to depolarization in SH-SY5Y cells. To monitor changes in membrane potential, a FLIPR membrane potential assay kit (Molecular Devices) was used as per the manufacturer's protocols. Data presented in RFUs. Cells were depolarized with increasing concentration of KCl, as in B. Error bars represent SD.

Comment in

References

    1. Bubien, J.K., L.J. Zhou, P.D. Bell, R.A. Frizzell, and T.F. Tedder. 1993. Transfection of the CD20 cell surface molecule into ectopic cell types generates a Ca2+ conductance found constitutively in B lymphocytes. J. Cell Biol. 121:1121–1132. - PMC - PubMed
    1. Clapham, D.E. 2003. TRP channels as cellular sensors. Nature. 426:517–524. - PubMed
    1. Clemens, J.C., C.A. Worby, N. Simonson-Leff, M. Muda, T. Maehama, B.A. Hemmings, and J.E. Dixon. 2000. Use of double-stranded RNA interference in Drosophila cell lines to dissect signal transduction pathways. Proc. Natl. Acad. Sci. USA. 97:6499–6503. - PMC - PubMed
    1. Cui, J., J.S. Bian, A. Kagan, and T.V. McDonald. 2002. CaT1 contributes to the store-operated calcium current in Jurkat T-lymphocytes. J. Biol. Chem. 277:47175–47183. - PubMed
    1. Fagan, K.A., K.E. Smith, and D.M. Cooper. 2000. Regulation of the Ca2+-inhibitable adenylyl cyclase type VI by capacitative Ca2+ entry requires localization in cholesterol-rich domains. J. Biol. Chem. 275:26530–26537. - PubMed

Publication types

MeSH terms