Comparative Study
. 2005 May;15(5):616-28.
doi: 10.1101/gr.3788705.

Generation and evolutionary fate of insertions of organelle DNA in the nuclear genomes of flowering plants

Affiliations
Comparative Study

Generation and evolutionary fate of insertions of organelle DNA in the nuclear genomes of flowering plants

Christos Noutsos et al. Genome Res. 2005 May.

Abstract

Nuclear genomes are exposed to a continuous influx of DNA from mitochondria and plastids. We have characterized the structure of approximately 750 kb of organelle DNA, distributed among 13 loci, in the nuclear genomes of Arabidopsis and rice. These segments are large and migrated to the nucleus quite recently, allowing us to reconstruct their evolution. Two general types of nuclear insertions coexist; one is characterized by long sequence stretches that are colinear with organelle DNA, the other type consists of mosaics of organelle DNA, often derived from both plastids and mitochondria. The levels of sequence divergence of the two types exclude their common descent, implying that at least two independent modes of DNA transfer from organelle to nucleus operate. The post-integration fate of organelle DNA is characterized by a predominance of transition mutations, associated with the gradual amelioration of the integrated sequence to the nucleotide composition of the host chromosome. Deletion of organelle DNA at these loci is essentially balanced by insertions of nonorganelle DNA. Deletions are associated with the removal of DNA between perfect repeats, indicating that they originate by replication slippage.


Figures
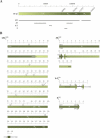
Figure 1.
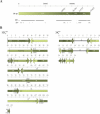
Figure 1.
Structure of long continuous insertions of ptDNA in the nuclear genome of O. sativa. (A) Structure of rice ptDNA (Os-pt). The position of the long (LSC) and short (SSC) single-copy regions, as well as of the two inverted repeats (IRA and IRB) are indicated. The four nuclear insertions (see bottom) are depicted as black lines below their regions of origin in the rice plastid chromosome. When the origin of a fragment of nuclear ptDNA was ambiguous, i.e., when derived from repetitive regions, it was assigned to the repeat located most 5′ of the organellar DNA. For instance, NUPTs solely homologous to IR-specific sequences were always assigned to IRB.(B) Structure of the four nuclear insertions of rice ptDNA formula image, formula image, formula image and formula image. Coloring and numbers indicate the position of the homologous sequence in the plastid chromosome based on the structure reported in A. The orientation of NUPTs relative to ptDNA is indicated by arrowheads; arrowheads pointing to the left indicate a reverse orientation. In the case of the IR regions of the ptDNA, the position of both homologous ptDNA sequences is provided. Fragments of ptDNA deleted from the nuclear integration are indicated by triangles with the size of the deletion indicated (e.g. “–14”) (see Table 3); short insertions or duplications are indicated accordingly (e.g. “+45”; duplications are highlighted by an asterisk; Supplemental Table 2). For formula image, the long insertion of nonorganelle DNA is indicated by a black line and the letter “i” (Supplemental Table 1).
Figure 2.
Figure 2.
Structures of the complex integrants formula image and formula image, which contain rearranged DNA from the rice plastid chromosome. A and B are depicted as in Figure 1. For formula image, the two large insertions of nonorganelle DNA are designated as “i1” and “i2” (Supplemental Table 1).
Figure 3.
Figure 3.
Structures of the complex integrants formula image and formula image, which contain rearranged DNA from the mitochondrial chromosome of Arabidopsis and rice, respectively. (A) Structure of the Arabidopsis (At-mt) and rice (Os-mt) mtDNAs. For the Arabidopsis mtDNA, the position of the four single-copy regions A, B, C, and D, as well as the three pairs of specific repeats (I, II, and III), are presented. Repeats I (positions 44,698–48,894 and 178,863–183,059) and II (103,805–104,337 and 227,087–227,619) are directly oriented, while the two repeat III sequences (112,147–118,736 and 297,580–290,991) are inverted. The portion of the mitochondrial chromosome included in each nuclear insertion (bottom) is indicated by black lines (as in the previous figures). (B) Structure of formula image and formula image, depicted according to the scheme used in Figures 1 and 2. For formula image, small NUMTs are indicated by Arabic numerals and the positions of their homologs in the Arabidopsis mtDNA are as follows: 1 (170,597–170,530); 2 (170,530–170,597); 3 (191,246–191,300); 4 (25,397–25,647); 5 (28,644–28,687); 6 (279,338–279,090); 7 (280,258–279,809); and 8 (191,552–192,070). Four major rearrangements can be recognized (see text). (1) A 5.5-kb region, derived from the D-region, is duplicated (positions 1–5545 and 47,106–52,650) in formula image. The two sequences are more similar to each other than to mtDNA, and both harbor a characteristic 68-bp insertion derived from region C (designated as “1” and “2”), suggesting that the insertion of this specific mtDNA segment in the nucleus occurred before the duplication. (2) A 2.6-kb region (positions 5546–8207), derived from region C, is inserted between the D′ terminus of the mtDNA insertion (see above) and the 5.5-kb duplication described above. (3) A 1.8-kb stretch, containing a structure of six short NUMTs, together with very short stretches of nonorganelle DNA, is present at positions 74,295–76,084. The six NUMTs derive from all four major regions of the mtDNA (including those absent at the A/D junction: see text and below). The 1.8-kb insertion is flanked by a duplication of 9 bp (CTTTACGAG) present in the D region, implying that it was inserted after formation of the D′–A′–C–B structure. (4) At positions 129,022–129,597, between A region and III-type repeat, a short stretch of the B region is found. This could be the result of imprecise homologous recombination between repeat III sequences, affecting the B region adjacent to one of the repeats. Alternatively, this short region might represent the beginning of the 350-kb duplication that was previously detected in formula image, but not sequenced (Stupar et al. 2001). For formula image, the two large insertions of nonorganelle DNA into nuclear DNA of organellar origin are designated as “i1” and “i2” (Supplemental Table 1). (C) Rearrangements of the Arabidopsis mtDNA due to recombination across repeat regions. The four single-copy regions A, B, C, and D are separated by two pairs of repeats (I: direct repeats, III: inverted repeats); recombinations involving repeat II sequences are not shown because they are not relevant for the generation of formula image. Recombination across repeat II sequences results in A–D and B–C circles, while the A–B–D′–C′ structure derives from III–III recombination (D′ and C′ refer to inverted D and C sequences, respectively). The A–D–B′–C′ arrangement originates from the normal A–B–C–D structure by two rounds of recombination; the first, between the pair of repeat III sequences, inverts the orientation of one of the repeat I sequences, allowing a second recombination between the now inverted repeat I sequences, resulting in an A–D–B′–C′ circle. Another alternative structure, A–C′–B–D′, has been described before (Klein et al. 1994; Unseld et al. 1997). (D) Origin of formula image. The structure of formula image is depicted as a circle around mtDNA of the A–D–B′–C′-type. The formula image insertion contains the four major segments of mtDNA in the order D′–A′–C–B, whereby parts of D′ and A′ are either absent in the nuclear mtDNA sequence, or form part of the 350-kb duplication for which no sequence information is available (Stupar et al. 2001). The deletion at the A/D junction is indicated by the dotted segment of the circle and contains mtDNA from position 183,060–209, 928 (region D), an entire I-type repeat, and the region extending from 343,608 to 44,697 (from region A) (see A). The breakpoint (indicated by an asterisk) that gave rise to the linear D′–A′–C–B structure should be located in region D, close to the type III repeat; in fact, both ends of formula image consist of sequences from the D region. Additional rearrangements of formula image, in particular the duplication resulting in the 350-kb region identified before (Stupar et al. 2001), are indicated by arrows.
Figure 4.
Figure 4.
Structure of the complex insertions formula image, formula image, formula image, formula image and formula image, which contain rearranged DNA from both ptDNA and mtDNA of (A) The structures of mtDNA and ptDNA and the portions found in the five insertions (see B) are shown, following the scheme used in the previous figures. In B, the structures of the five nuclear insertions containing both ptDNA and mtDNA (formula image, formula image, formula image, formula image and formula image) are shown. For formula image the four large inserts of nonorganelle DNA are designated as “i1” to “i4”, and for formula image and formula image as “i” (Supplemental Table 1).
Figure 5.
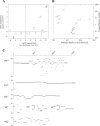
Figure 5.
Relationships between base composition, structure, and sequence divergence of large insertions of nuclear organelle DNA. (A) The G/C content of the insertion comes to resemble that of its nuclear chromosomal neighborhood. The primary insertion is assumed to have had the same G/C content as the corresponding region of pt/mtDNA. The G/C contents of the chromosomal regions hosting the insertions are based on those of the 300 kb of nuclear DNA immediately flanking the respective insertion. White boxes indicate segments with an overall similarity of >99.5% to pt/mtDNA; the insertions indicated as gray boxes are less similar to organellar DNA. The two integrants with the highest transition/transversion ratios are indicated in bold. (B) Relationship between average fragment size and sequence divergence. The level of sequence identity between insertion and organellar DNA was calculated using the BESTFIT algorithm of the GCG package, which considers both nucleotide exchanges and InDels (Devereux et al. 1984). Average fragment sizes were obtained from columns 2 and 4 of Table 1. Squares indicate long continuous integrants; open circles symbolize complex insertions derived from one organelle; and shaded circles stand for complex insertions, including sequences from both organelles. (C) Intra-insertion patterns of sequence divergence. Sequence identity between NUPTs and ptDNA and between NUMTs and mtDNA was assessed for the five largest complex loci as in B. NUPTs and NUMTs larger than 1 kb were considered. Insertion formula image served as control. It consists of one large continuous NUPT subdivided into sets of fragments with sizes ranging from 20 kp to 1 kb; the level of its overall sequence identity is indicated by a gray line. In formula image, NUPTs are indicated by continuous lines and NUMTs by dotted lines. Note that the more diverged fragments in formula image (26,331–31,363; 31,686–45,533; 46,267–53,135) are mostly derived from the IR region; in formula image (55,367–56,927; 66,220–68,636; 75,288–81,711; 81,712–83,231) they originate from the IR region, and from positions 55,000–60,000 of ptDNA. The most diverged regions in formula image (10,721–16,939; 16,940–20,685) derive again from IR sequences.

Similar articles

Cited by

References

    1. Adams, K.L. and Palmer, J.D. 2003. Evolution of mitochondrial gene content: Gene loss and transfer to the nucleus. Mol. Phylogenet. Evol. 29: 380–395. - PubMed
    1. Adams, K.L., Daley, D.O., Qiu, Y.L., Whelan, J., and Palmer, J.D. 2000. Repeated, recent and diverse transfers of a mitochondrial gene to the nucleus in flowering plants. Nature 408: 354–357. - PubMed
    1. Adams, K.L., Rosenblueth, M., Qiu, Y.L., and Palmer, J.D. 2001. Multiple losses and transfers to the nucleus of two mitochondrial succinate dehydrogenase genes during angiosperm evolution. Genetics 158: 1289–1300. - PMC - PubMed
    1. Altschul, S.F., Gish, W., Miller, W., Myers, E.W., and Lipman, D.J. 1990. Basic local alignment search tool. J. Mol. Biol. 215: 403–410. - PubMed
    1. Ayliffe, M.A., Scott, N.S., and Timmis, J.N. 1998. Analysis of plastid DNA-like sequences within the nuclear genomes of higher plants. Mol. Biol. Evol. 15: 738–745. - PubMed

Publication types

LinkOut - more resources