Comparative Study
. 2005 Jun;3(6):e187.
doi: 10.1371/journal.pbio.0030187. Epub 2005 May 10.

Determination of stromal signatures in breast carcinoma

Affiliations
Comparative Study

Determination of stromal signatures in breast carcinoma

Robert B West et al. PLoS Biol. 2005 Jun.

Abstract

Many soft tissue tumors recapitulate features of normal connective tissue. We hypothesize that different types of fibroblastic tumors are representative of different populations of fibroblastic cells or different activation states of these cells. We examined two tumors with fibroblastic features, solitary fibrous tumor (SFT) and desmoid-type fibromatosis (DTF), by DNA microarray analysis and found that they have very different expression profiles, including significant differences in their patterns of expression of extracellular matrix genes and growth factors. Using immunohistochemistry and in situ hybridization on a tissue microarray, we found that genes specific for these two tumors have mutually specific expression in the stroma of nonneoplastic tissues. We defined a set of 786 gene spots whose pattern of expression distinguishes SFT from DTF. In an analysis of DNA microarray gene expression data from 295 previously published breast carcinomas, we found that expression of this gene set defined two groups of breast carcinomas with significant differences in overall survival. One of the groups had a favorable outcome and was defined by the expression of DTF genes. The other group of tumors had a poor prognosis and showed variable expression of genes enriched for SFT type. Our findings suggest that the host stromal response varies significantly among carcinomas and that gene expression patterns characteristic of soft tissue tumors can be used to discover new markers for normal connective tissue cells.


Figures

Figure 1
Figure 1. Soft Tissue Tumor Gene Expression
Unsupervised hierarchical clustering of ten cases of DTF (blue), 13 cases of SFT (orange), and 35 other previously examined soft tissue tumors (black) based on expression profiling on 42,000-element cDNA microarrays. Red represents high expression, black represents median expression, green represents low expression, and grey represents no data. Gene array data are available at http://microarray-pubs.stanford.edu/tma-portal/DTF_SFTbreast. DFSP, dermatofibrosarcoma protuberans; GIST, gastrointestinal stromal tumor; LMS, leiomyosarcomas, MFH, malignant fibrous histiocytomas; SS, synovial sarcoma.
Figure 2
Figure 2. Localization of Fibroblastic Gene Expression
Comparison of expression of two SFT markers APOD (ISH) and CD34 (IHC), and two DTF markers CTHRC1 (ISH) and OSF2 (ISH) in SFT and DTF. SFTs express ApoD and CD34 whereas DTFs express CTHRC1 and OSF2. H&E, hematoxylin-eosin. Magnification = 600×.
Figure 3
Figure 3. Fibroblastic Markers in Non-Neoplastic Tissue
(A) Skin adnexa, (B) breast, (C) dermis, (D) reactive, and (E) keloid tissue arranged in rows. Fibroblastic markers: CD34 (IHC), APOD (ISH), CTHRC1 (ISH) and OSF2 (ISH) arranged in columns. SFTs express APOD and CD34 whereas DTFs express CTHRC1 and OSF2. Magnification = 600×. (A magnification of 300× is shown in Figure S3.)
Figure 4
Figure 4. Fibroblast Markers in Breast Carcinoma
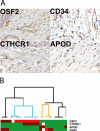
(A) Examples of SFT (APOD [ISH] and CD34 ) and DTF (CTHRC1 [ISH] and OSF2 [ISH]) expression in breast carcinoma stroma. Each panel shows expression of the marker that is restricted to the fibroblasts between neoplastic cells. Magnification = 600×. (B) Hierarchical clustering of 24 breast carcinomas based on TMA staining with fibroblast markers: CD34 (IHC), APOD (ISH), CTHRC1 (ISH), and OSF2 (ISH). Bright red represents high expression, dull red represents intermediate high expression, green represents negative expression, and white represents no data. The DTF-associated cluster is highlighted in blue. The SFT-associated cluster is highlighted in orange. Most breast carcinomas express either a DTF or SFT gene in the stromal fibroblasts. However, some breast carcinomas express a combination of DTF and SFT genes, and some express neither.
Figure 5
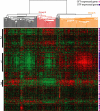
Figure 5. Hierarchical Clustering of 295 Breast Carcinomas with 471 SFT and DTF Genes
Within the heatmap, red represents high expression, black represents median expression, and green represents low expression. Sidebar on right indicates which tumor the gene is positively associated with: pink is SFT and purple is DTF. Sidebar on left indicates gene cluster. Gene array data are available at http://microarray-pubs.stanford.edu/tma-portal/DTF_SFTbreast.
Figure 6
Figure 6. Outcome Data
Statistical method of the y-axis is Kaplan-Meier survival curves compared by the Cox-Mantel log-rank test. The x-axis unit of measure is years. (A) Time to first recurrence for tumor group A versus all other tumors. (B) Time to first recurrence for tumor group B versus all other tumors. (C) Survival outcome for tumor group A versus all others. (D) Survival outcome for tumor group B versus all others

References

    1. Kempson RL, Fletcher CDM, Evans HL, Hendrickson MR, Sibley RK. Tumors of the soft tissues. Atlas of tumor pathology, series III. Rosai J, editor. Washington: AFIP; 1998. pp. 1–21.
    1. England DM, Hochholzer L, McCarthy MJ. Localized benign and malignant fibrous tumors of the pleura. A clinicopathologic review of 223 cases. Am J Surg Pathol. 1989;13:640–658. - PubMed
    1. Fukunaga M, Naganuma H, Ushigome S, Endo Y, Ishikawa E. Malignant solitary fibrous tumour of the peritoneum. Histopathology. 1996;28:463–466. - PubMed
    1. Moran CA, Suster S, Koss MN. The spectrum of histologic growth patterns in benign and malignant fibrous tumors of the pleura. Semin Diagn Pathol. 1992;9:169–180. - PubMed
    1. van de Rijn M, Lombard CM, Rouse RV. Expression of CD34 by solitary fibrous tumors of the pleura, mediastinum, and lung. Am J Surg Pathol. 1994;18:814–820. - PubMed

Publication types