Transmission dynamics of parasitic sea lice from farm to wild salmon
- PMID: 15870031
- PMCID: PMC1602048
- DOI: 10.1098/rspb.2004.3027
Transmission dynamics of parasitic sea lice from farm to wild salmon
Abstract
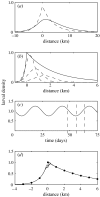
Marine salmon farming has been correlated with parasitic sea lice infestations and concurrent declines of wild salmonids. Here, we report a quantitative analysis of how a single salmon farm altered the natural transmission dynamics of sea lice to juvenile Pacific salmon. We studied infections of sea lice (Lepeophtheirus salmonis and Caligus clemensi) on juvenile pink salmon (Oncorhynchus gorbuscha) and chum salmon (Oncorhynchus keta) as they passed an isolated salmon farm during their seaward migration down two long and narrow corridors. Our calculations suggest the infection pressure imposed by the farm was four orders of magnitude greater than ambient levels, resulting in a maximum infection pressure near the farm that was 73 times greater than ambient levels and exceeded ambient levels for 30 km along the two wild salmon migration corridors. The farm-produced cohort of lice parasitizing the wild juvenile hosts reached reproductive maturity and produced a second generation of lice that re-infected the juvenile salmon. This raises the infection pressure from the farm by an additional order of magnitude, with a composite infection pressure that exceeds ambient levels for 75 km of the two migration routes. Amplified sea lice infestations due to salmon farms are a potential limiting factor to wild salmonid conservation.
Figures


References
-
- Bjørn P.A, Finstad B. The physiological effects of salmon lice infection on sea trout post smolts. Nord. J. Freshw. Res. 1997;73:60–72.
-
- Bjørn P.A, Finstad B. Salmon lice, Lepeophtheirus salmonis (Krøyer), infestation in sympatric populations of arctic char, Salvelinus alpinus (L.), and sea trout, Salmo trutta (L.), in areas near and distant from salmon farms. ICES J. Mar. Sci. 2002;59:131–139.
-
- Bjørn P.A, Finstad B, Kristoffersen R. Salmon lice infection of wild sea trout and arctic char in marine and freshwaters: the effects of salmon farms. Aquac. Res. 2001;32:947–962.
-
- Burnham K, Anderson D. Springer; New York: 2002. Model selection and multimodal inference: a practical information theoretic approach.
-
- Carr J, Whoriskey F. Sea lice infestation rates on wild and escaped farmed Atlantic salmon (Salmo Salar L.) entering the Magaguadavic River, New Brunswick. Aquac. Res. 2004;35:723–729.
Publication types
MeSH terms
LinkOut - more resources
Full Text Sources
Other Literature Sources
Medical

