

Polyclonality of familial murine adenomas: analyses of mouse chimeras with low tumor multiplicity suggest short-range interactions
- PMID: 15870186
- PMCID: PMC1100801
- DOI: 10.1073/pnas.0502662102
Polyclonality of familial murine adenomas: analyses of mouse chimeras with low tumor multiplicity suggest short-range interactions
Abstract
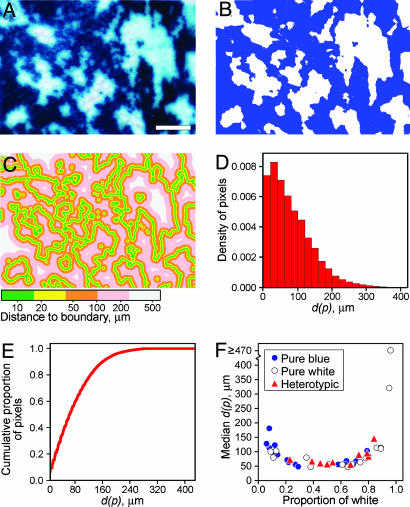
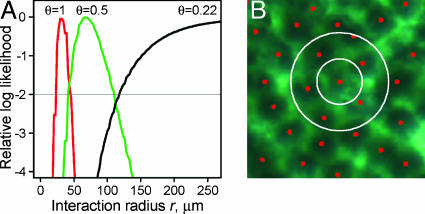
In previous studies demonstrating the polyclonal structure of familial intestinal adenomas, high tumor multiplicity made it difficult to eliminate the possibility that polyclonality arose by the random collision of distinct initiated clones as opposed to some form of clonal interaction. We sought to test further the random collision hypothesis. Chimeric mice carrying the multiple intestinal neoplasia (Min) mutation of the adenomatous polyposis coli gene (Apc) and homozygous for the tumor resistance allele of the Mom1 locus were established. These chimeras also display a strong propensity for tumors of polyclonal structure, despite their markedly reduced tumor multiplicity. Considering tumor sizes and multiplicities, the observed fraction of overtly polyclonal heterotypic adenomas was significantly higher than predicted by the random collision hypothesis. This finding supports models of polyclonality involving interaction among multiple initiated clones. The extent of clonal interaction was assessed by statistical analyses that relate the observed frequency of overtly polyclonal heterotypic tumors to the geometry of the chimeric patches and the pattern of underlying crypts. These statistical calculations indicate that the familial adenomas of the Apc(Min/+) mouse may commonly form through interactions between clones as close as 1-2 crypt diameters apart.
Figures


Similar articles
-
Clonal structure of carcinogen-induced intestinal tumors in mice.Cancer Prev Res (Phila). 2011 Jun;4(6):916-23. doi: 10.1158/1940-6207.CAPR-11-0022. Cancer Prev Res (Phila). 2011. PMID: 21636550 Free PMC article.
-
Gastrointestinal stem cells and cancer: bridging the molecular gap.Stem Cell Rev. 2005;1(3):233-41. doi: 10.1385/SCR:1:3:233. Stem Cell Rev. 2005. PMID: 17142860 Review.
-
Clonality assessment and clonal ordering of individual neoplastic crypts shows polyclonality of colorectal adenomas.Gastroenterology. 2010 Apr;138(4):1441-54, 1454.e1-7. doi: 10.1053/j.gastro.2010.01.033. Epub 2010 Jan 25. Gastroenterology. 2010. PMID: 20102718
-
The intestinal epithelium and its neoplasms: genetic, cellular and tissue interactions.Philos Trans R Soc Lond B Biol Sci. 1998 Jun 29;353(1370):915-23. doi: 10.1098/rstb.1998.0256. Philos Trans R Soc Lond B Biol Sci. 1998. PMID: 9684289 Free PMC article. Review.
-
Polyclonal structure of intestinal adenomas in ApcMin/+ mice with concomitant loss of Apc+ from all tumor lineages.Proc Natl Acad Sci U S A. 1997 Dec 9;94(25):13927-31. doi: 10.1073/pnas.94.25.13927. Proc Natl Acad Sci U S A. 1997. PMID: 9391129 Free PMC article.
Cited by
-
Advanced Intestinal Cancers often Maintain a Multi-Ancestral Architecture.PLoS One. 2016 Feb 26;11(2):e0150170. doi: 10.1371/journal.pone.0150170. eCollection 2016. PLoS One. 2016. PMID: 26919712 Free PMC article.
-
Transformation of epithelial cells through recruitment leads to polyclonal intestinal tumors.Proc Natl Acad Sci U S A. 2013 Jul 9;110(28):11523-8. doi: 10.1073/pnas.1303064110. Epub 2013 Jun 24. Proc Natl Acad Sci U S A. 2013. PMID: 23798428 Free PMC article.
-
Surface microstructures are associated with mutational intratumoral heterogeneity in colorectal tumors.J Gastroenterol. 2018 Dec;53(12):1241-1252. doi: 10.1007/s00535-018-1481-z. Epub 2018 Jun 11. J Gastroenterol. 2018. PMID: 29948303
-
Multi-ancestral origin of intestinal tumors: Impact on growth, progression, and drug efficacy.Cancer Rep (Hoboken). 2022 Feb;5(2):e1459. doi: 10.1002/cnr2.1459. Epub 2021 Jul 10. Cancer Rep (Hoboken). 2022. PMID: 34245130 Free PMC article.
-
Clonal structure of carcinogen-induced intestinal tumors in mice.Cancer Prev Res (Phila). 2011 Jun;4(6):916-23. doi: 10.1158/1940-6207.CAPR-11-0022. Cancer Prev Res (Phila). 2011. PMID: 21636550 Free PMC article.
References
-
- Ponder, B. A. J. & Wilkinson, M. M. (1986) J. Natl. Cancer Inst. 77, 967–973. - PubMed
-
- Fearon, E. R., Hamilton, S. R. & Vogelstein, B. (1987) Science 238, 193–197. - PubMed
-
- Novelli, M. R., Williamson, J. A., Tomlinson, I. P. M., Elia, G., Hodgson, S. V., Talbot, I. C., Bodmer, W. F. & Wright, N. A. (1996) Science 272, 1187–1190. - PubMed
Publication types
MeSH terms
Substances
Grants and funding
LinkOut - more resources
Full Text Sources
Molecular Biology Databases
