. 2005 May;25(10):3997-4009.
doi: 10.1128/MCB.25.10.3997-4009.2005.

MyoD targets chromatin remodeling complexes to the myogenin locus prior to forming a stable DNA-bound complex

Affiliations

MyoD targets chromatin remodeling complexes to the myogenin locus prior to forming a stable DNA-bound complex

Ivana L de la Serna et al. Mol Cell Biol. 2005 May.

Abstract

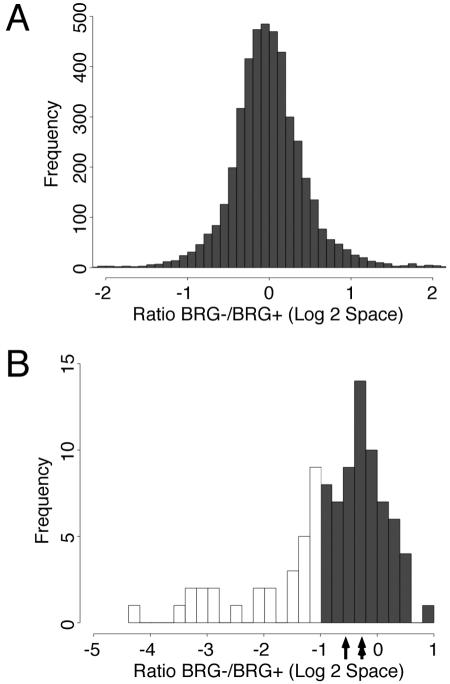
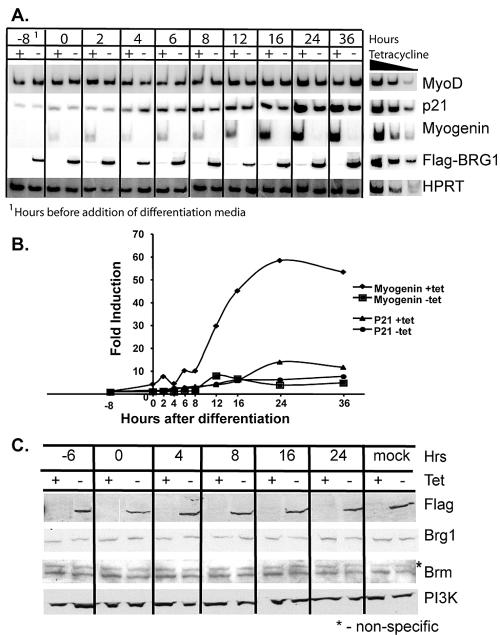
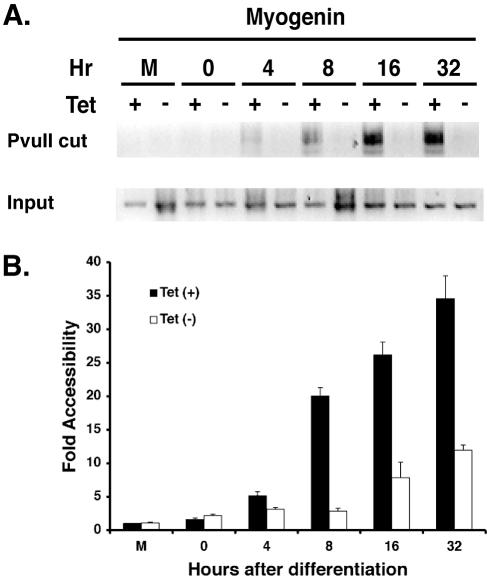
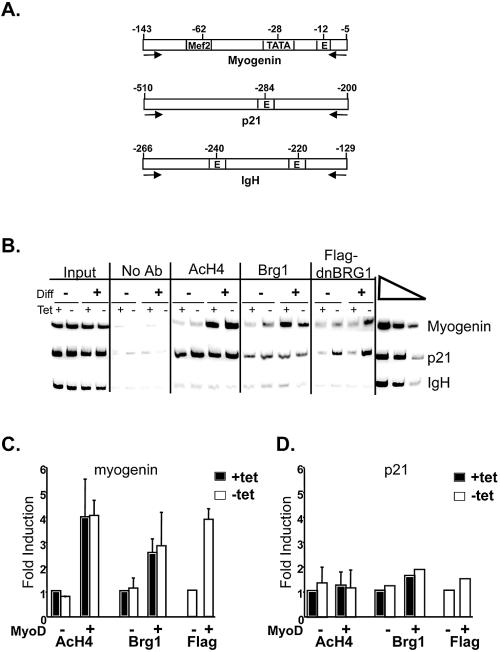
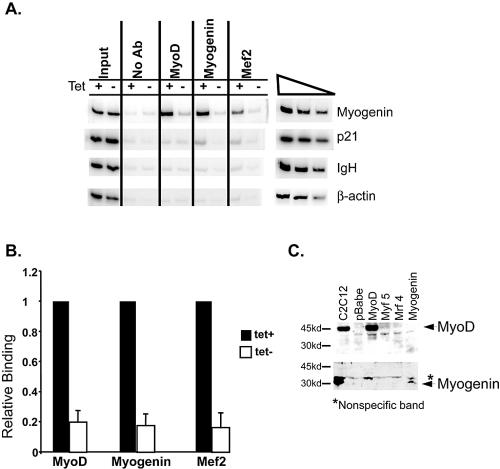
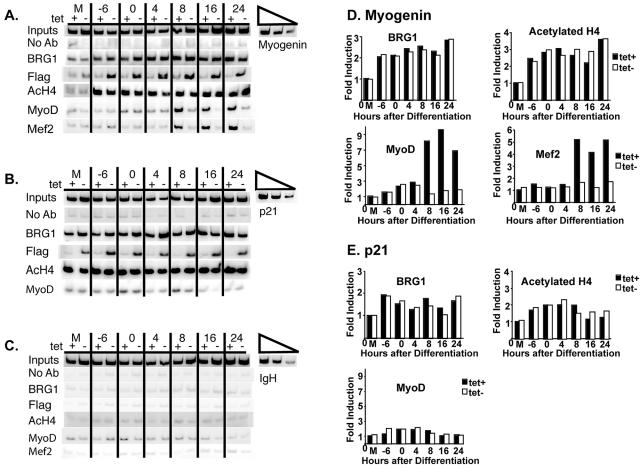
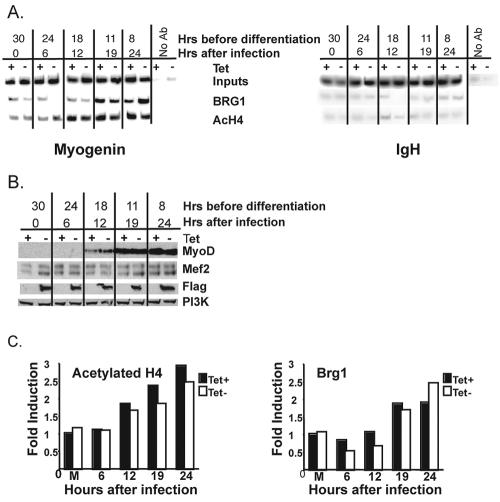
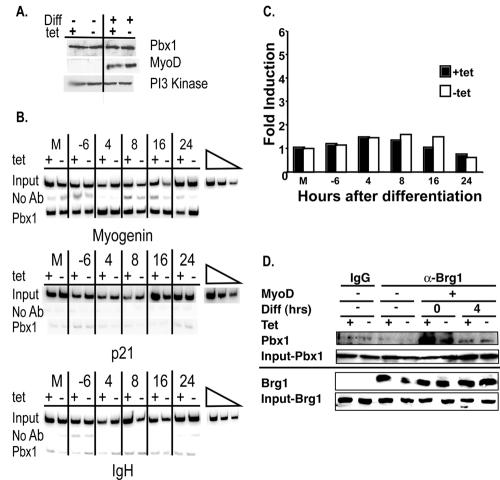
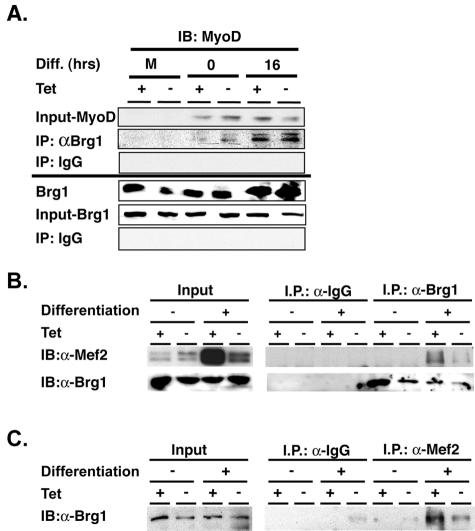
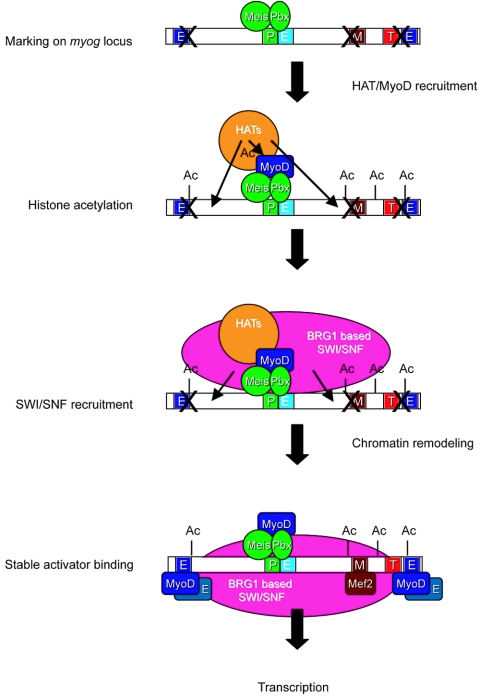
The activation of muscle-specific gene expression requires the coordinated action of muscle regulatory proteins and chromatin-remodeling enzymes. Microarray analysis performed in the presence or absence of a dominant-negative BRG1 ATPase demonstrated that approximately one-third of MyoD-induced genes were highly dependent on SWI/SNF enzymes. To understand the mechanism of activation, we performed chromatin immunoprecipitations analyzing the myogenin promoter. We found that H4 hyperacetylation preceded Brg1 binding in a MyoD-dependent manner but that MyoD binding occurred subsequent to H4 modification and Brg1 interaction. In the absence of functional SWI/SNF enzymes, muscle regulatory proteins did not bind to the myogenin promoter, thereby providing evidence for SWI/SNF-dependent activator binding. We observed that the homeodomain factor Pbx1, which cooperates with MyoD to stimulate myogenin expression, is constitutively bound to the myogenin promoter in a SWI/SNF-independent manner, suggesting a two-step mechanism in which MyoD initially interacts indirectly with the myogenin promoter and attracts chromatin-remodeling enzymes, which then facilitate direct binding by MyoD and other regulatory proteins.


Figures

FIG. 1.
FIG. 1.
(A) Histogram of the expression ratio in cells expressing dominant-negative BRG1 (BRG1−) to nonexpressing cells (BRG1+) for the 4,282 array features that reported reliable data. The median value in log2 space is −0.02. (B) Histogram of the BRG1−/BRG1+ expression ratio for the 94 genes upregulated by MyoD. Hollow boxes indicate the 29 genes identified as strongly BRG1 dependent at the twofold change (q < 0.05) threshold. The single-headed arrow indicates the median ratio for all 94 MyoD-dependent genes (−0.56). The double-headed arrow indicates the median for the 65 genes not identified as strongly BRG1 dependent (−0.23).
FIG. 2.
FIG. 2.
(A) Time course of myogenin, p21, and ectopic MyoD expression during differentiation. Cells expressing or not expressing dominant-negative flag-tagged BRG1 were infected with retrovirus containing MyoD. Thirty hours later, differentiation was initiated by replacement of the medium with a low-serum differentiation medium (time zero). mRNA levels of each gene were examined at the indicated time points by RT-PCR. The −8 time point is 8 h prior to addition of differentiation medium. A titration of twofold dilutions of cDNA shows the linearity of the PCRs. The 36-h time point, plus-tetracycline (Tet) sample, was used for all titrations except for Flag-tagged dominant-negative BRG1, which was amplified with the 36-h, minus-tetracycline sample. (B) Quantification of mRNA levels observed in panel A. Fold induction was defined as the ratio of myogenin or p21 levels in a given sample relative to the levels of Hprt in the same sample and standardized to the −8-h time point. (C) Time course of dominant-negative BRG1, total Brg1, and Brm protein levels during differentiation. A Western blot was performed with protein extracts isolated at the indicated time points. “Mock” refers to the samples that were not infected with the MyoD-encoding retrovirus but were instead mock infected, subjected to the same differentiation protocol, and harvested 24 h after the addition of differentiation medium.
FIG. 3.
FIG. 3.
Restriction enzyme accessibility increases at the endogenous myogenin promoter as a function of MyoD-induced differentiation and requires functional Brg1 based-SWI/SNF enzymes. Nuclei were isolated from cells that were differentiated in the presence or absence of tetracycline at the indicated time points or from cells that were mock differentiated (M) in the presence or absence of tetracycline. The mock-differentiated cells were not infected with the MyoD-encoding retrovirus but were subjected to the differentiation protocol for 32 h. (A) A modified LM-PCR protocol (see Materials and Methods) was utilized to visualize cleaved genomic DNA isolated from nuclei digested with PvuII, which cleaves the myogenin promoter at −370 relative to the start site of transcription. The PCR product was visualized by Sybr Green I staining, and an inverse image is shown. To monitor the input DNA, 10% of the amount of purified, cleaved DNA that was used for ligation-mediated PCR was used to amplify the sequences between −143 and −5 of the myogenin promoter, which contain no PvuII site. (B) Quantification of the change in nuclease accessibility at the myogenin promoter. The relative values for each time point were normalized to input and graphed relative to the value obtained for cleavage in the mock-differentiated, plus-tetracycline [Tet(+)] sample, which was arbitrarily set at 1.0. Each value is the mean ± standard deviation from three independent experiments.
FIG. 4.
FIG. 4.
Brg1 and hyperacetylated H4 are associated with the myogenin promoter. (A) A schematic diagram indicating the regions of the myogenin and p21 promoters and the IgH enhancer that were amplified. Arrows indicate the location and direction of primers used for amplification. The approximate locations of transcription factor binding sites are indicated. (B) Chromatin immunoprecipitations were performed with antisera against BRG1, Flag, or tetra-acetylated histone H4 (AcH4) or with no antibody (No Ab) on mock-differentiated (−) or MyoD-differentiated (+) samples that had been cultured in the presence or absence of tetracycline (tet) and that were harvested for analysis 36 h after the onset of differentiation. PCR amplification of 1% of the input DNA is shown on the left. A twofold titration of input DNA using the undifferentiated, plus-tetracycline sample was performed (far right) to show that the PCR was in the linear range. (C and D) Quantification of the levels of hyperacetylated H4, Brg1, and Flag-tagged dominant-negative BRG1 present on the myogenin and p21 promoters by ChIP analysis. Band intensities in each lane were normalized to input. Induction relative to the plus-tetracycline, mock-differentiated sample is shown for hyperacetylated H4 and Brg1. Induction relative to the minus-tetracycline, mock-differentiated sample is shown for Flag-tagged dominant-negative BRG1. The data reflect the means ± standard deviations from three to four independent experiments, except for the levels of Brg1 and Flag-tagged dominant-negative Brg1 on the p21 promoter, which reflect the average values from two independent experiments.
FIG. 5.
FIG. 5.
Binding of muscle regulatory proteins to the myogenin promoter is inhibited by dominant-negative BRG1. (A) Chromatin immunoprecipitations were performed with antisera against MyoD, myogenin, or Mef2 or with no antibody (No Ab) on MyoD-differentiated samples that had been cultured in the presence or absence of tetracycline (tet) and that were harvested for analysis 36 h after the onset of differentiation. PCR amplification of 0.5% of the input DNA is shown on the left. A twofold titration of input DNA using the undifferentiated, plus-tetracycline sample was performed (far right) to show that the PCR was in the linear range. (B) Quantification of the level of MyoD, myogenin, or Mef2 present on the myogenin promoter by ChIP analysis. Band intensities in each lane were normalized to input. The decrease in promoter association due to the expression of dominant-negative BRG1 is expressed relative to the differentiated, plus-tetracycline sample, which was set at 1.0. The data reflect the mean ± standard deviation from three independent experiments. (C) MyoD and myogenin antisera do not cross-react. Protein extracts from C2C12 myotubes or NIH 3T3 cells infected with MyoD, myogenin-, MRF4-, or Myf5-containing retrovirus or the empty retroviral vector (pBABE) were run on an SDS-polyacrylamide gel, blotted, and probed with either anti-MyoD or antimyogenin antiserum.
FIG. 6.
FIG. 6.
Brg1 and acetylated H4 associate with the myogenin promoter prior to stable binding of MyoD and Mef2. Shown is a time course of histone H4 acetylation, total Brg1, dominant-negative BRG1, MyoD, and Mef2 association with (A) the myogenin promoter, (B) the p21 promoter, and (C) the IgH enhancer as measured by ChIP during a time course of differentiation induced by MyoD in the presence or absence of tetracycline (tet). M indicates samples that were mock differentiated for 24 h. “No Ab” indicates ChIP reactions performed in the absence of antibody. Linearity of the PCRs was demonstrated by twofold titrations of input DNA using the mock-differentiated, plus-tetracycline sample. PCR amplification of 1% of the input DNA is shown. (D and E) Quantification of the levels of acetylated H4, Brg1, MyoD, or Mef2 present on the myogenin promoter (D) or on the p21 promoter (E) by ChIP analysis. Band intensities in each lane were normalized to input. Induction relative to the plus-tetracycline, mock-differentiated sample is shown. The data reflect the average value from two independent experiments.
FIG. 7.
FIG. 7.
(A) Histone H4 hyperacetylation precedes the binding of Brg1 at the myogenin promoter. Shown is a time course of histone H4 hyperacetylation and Brg1 association with the myogenin promoter. Cells were grown in the presence or absence of tetracycline (Tet), infected or not with MyoD-encoding retrovirus, and harvested for ChIP at the indicated times prior to the addition of differentiation medium. Time points are also indicated as hours following retroviral infection. Association with the IgH enhancer is presented as a control. One percent of the input is shown. (B) Western analysis of MyoD and Mef2 protein present at the indicated times prior to addition of differentiation medium. Anti-Flag antiserum was used to document the presence of the Flag-tagged dominant-negative BRG1. PI 3-kinase (PI3K) is shown as a loading control. (C) Quantification of the levels of acetylated H4 and Brg1 present on the myogenin promoter by ChIP analysis. Band intensities in each lane were normalized to input. Induction of levels of association is presented relative to the plus-tetracycline, mock-differentiated sample. The data reflect the average value from two independent experiments.
FIG. 8.
FIG. 8.
Pbx1 mediates targeting of Brg1 to the myogenin promoter. (A) Pbx1 protein levels are unaffected by differentiation (Diff.) or by the expression of dominant-negative BRG1. Protein extracts from mock-differentiated cells (−) or cells differentiated with MyoD (+) in the presence or absence of tetracycline were run on an SDS-polyacrylamide gel and probed with Pbx1, MyoD, or PI 3-kinase antibodies. (B) Pbx1 association with the myogenin promoter, the p21 promoter, and the IgH enhancer as measured by ChIP during a time course of differentiation induced by MyoD. M indicates samples that were mock differentiated for 24 h. The linearity of the PCRs was demonstrated by a twofold titration of input DNAs using the mock-differentiated, plus-tetracycline (+tet) sample. PCR amplification of 1% of the input DNA is shown. (C) Quantification of Pbx1 association with the myogenin promoter. Band intensities in each lane were normalized to input. Induction relative to the plus-tetracycline, mock-differentiated sample is shown. The data reflect the average of values from two independent experiments. (D) Endogenous Pbx1 and Brg1 coimmunoprecipitate from MyoD-differentiated but not mock-differentiated cells. Nuclear extracts from mock (−) or MyoD-differentiated (+) cells were immunoprecipitated with Brg1 antibody or purified IgG as indicated, and the immunoprecipitated material was run on an SDS-polyacrylamide gel, transferred to a membrane, and probed for the presence of Pbx1 and Brg1. The levels of Pbx1 and Brg1 present in 10% of the input for each sample are shown.
FIG. 9.
FIG. 9.
Brg1 interacts with MyoD and Mef2 in differentiating cells. Extracts were prepared from mock-differentiated cells or cells differentiated with MyoD in the presence or absence of tetracycline. (A) Immunoprecipitation from nuclear extracts from cells that were mock differentiated (M) or MyoD differentiated was performed using purified IgG or antibody against Brg1 at the times indicated. Samples were run on an SDS-polyacrylamide gel and transferred to a membrane for Western blotting with MyoD and Brg1 antibodies. Ten percent of the input for each sample is shown. The samples shown in Fig. 8D and 9A were from the same time course; the Brg1 input and Brg1 IP bands for the mock and 0-h time point are the same data that were presented in Fig. 8D. (B and C) Nuclear extracts were immunoprecipitated from cells mock (−) or MyoD (+) differentiated in the presence or absence of tetracycline for 36 h using purified IgG or antibody against Brg1 or Mef2 and probed for the presence of Mef2 or Brg1. Confirmation of Mef2 immunoprecipitation by the Mef2 antibody could not be obtained because the Mef2 band was obscured by the antibody heavy chains.
FIG. 10.
FIG. 10.
A cartoon model of the order of events occurring during activation of the endogenous myogenin locus in MyoD-differentiated cells. Bold “X” marks placed over transcription factor binding sites indicate that the sites are inaccessible to factor binding. “P” indicates a Pbx binding site, “M” indicates a Mef2 binding site, “T” indicates the TATA box, and “E” indicates E boxes, which bind MyoD. The nonconsensus E box adjacent to the Pbx1 binding site is indicated in light blue to distinguish it from consensus binding sites elsewhere.

References

    1. Agalioti, T., S. Lomvardas, B. Parekh, J. Yie, T. Maniatis, and D. Thanos. 2000. Ordered recruitment of chromatin modifying and general transcription factors to the IFN-beta promoter. Cell 103:667-678. - PubMed
    1. Bergstrom, D. A., B. H. Penn, A. Strand, R. L. Perry, M. A. Rudnicki, and S. J. Tapscott. 2002. Promoter-specific regulation of MyoD binding and signal transduction cooperate to pattern gene expression. Mol. Cell 9:587-600. - PubMed
    1. Bergstrom, D. A., and S. J. Tapscott. 2001. Molecular distinction between specification and differentiation in the myogenic basic helix-loop-helix transcription factor family. Mol. Cell. Biol. 21:2404-2412. - PMC - PubMed
    1. Berkes, C., D. A. Bergstrom, B. H. Penn, K. J. Sever, S. Knoepfler, and S. J. Tapscott. 2004. Pbx and Meis mark genes for activation by MyoD indicating a role for homeodomain genes in establishing myogenic potential. Mol. Cell 14:465-477. - PubMed
    1. Brown, S. A., A. N. Imbalzano, and R. E. Kingston. 1996. Activator-dependent regulation of transcriptional pausing on nucleosomal templates. Genes Dev. 10:1479-1490. - PubMed

Publication types

MeSH terms

Substances

LinkOut - more resources