

Dynamical remodeling of the transcriptome during short-term anaerobiosis in Saccharomyces cerevisiae: differential response and role of Msn2 and/or Msn4 and other factors in galactose and glucose media
- PMID: 15870279
- PMCID: PMC1087712
- DOI: 10.1128/MCB.25.10.4075-4091.2005
Dynamical remodeling of the transcriptome during short-term anaerobiosis in Saccharomyces cerevisiae: differential response and role of Msn2 and/or Msn4 and other factors in galactose and glucose media
Abstract
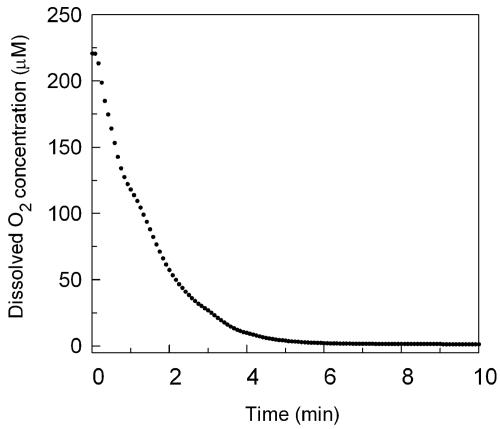
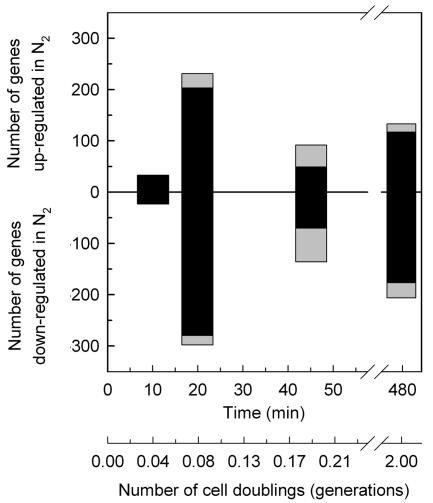
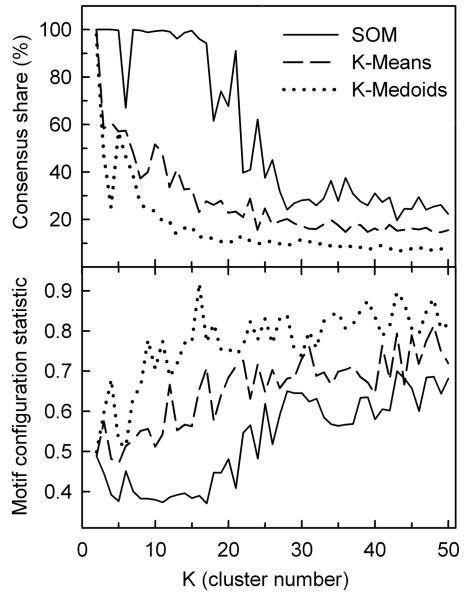
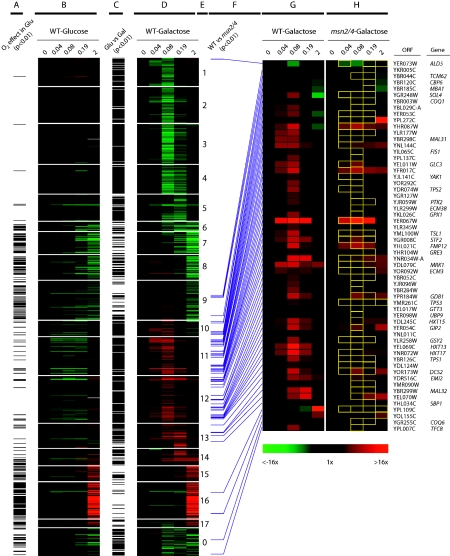
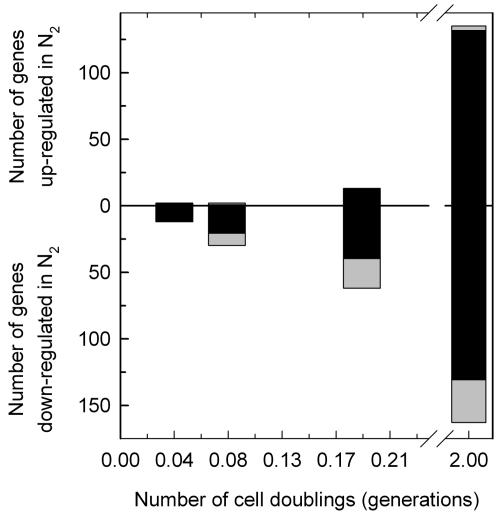
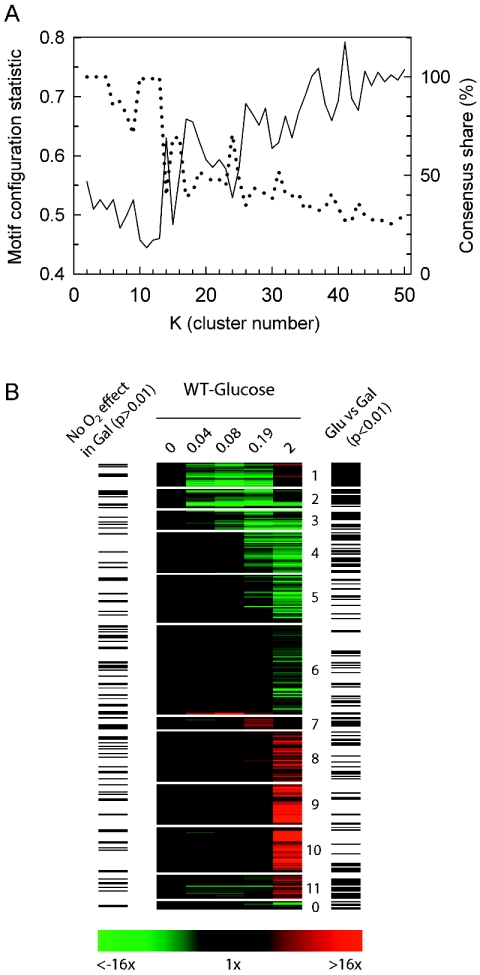
In contrast to previous steady-state analyses of the O(2)-responsive transcriptome, here we examined the dynamics of the response to short-term anaerobiosis (2 generations) in both catabolite-repressed (glucose) and derepressed (galactose) cells, assessed the specific role that Msn2 and Msn4 play in mediating the response, and identified gene networks using a novel clustering approach. Upon shifting cells to anaerobic conditions in galactose medium, there was an acute ( approximately 10 min) yet transient (<45 min) induction of Msn2- and/or Msn4-regulated genes associated with the remodeling of reserve energy and catabolic pathways during the switch from mixed respiro-fermentative to strictly fermentative growth. Concomitantly, MCB- and SCB-regulated networks associated with the G(1)/S transition of the cell cycle were transiently down-regulated along with rRNA processing genes containing PAC and RRPE motifs. Remarkably, none of these gene networks were differentially expressed when cells were shifted in glucose, suggesting that a metabolically derived signal arising from the abrupt cessation of respiration, rather than O(2) deprivation per se, elicits this "stress response." By approximately 0.2 generation of anaerobiosis in both media, more chronic, heme-dependent effects were observed, including the down-regulation of Hap1-regulated networks, derepression of Rox1-regulated networks, and activation of Upc2-regulated ones. Changes in these networks result in the functional remodeling of the cell wall, sterol and sphingolipid metabolism, and dissimilatory pathways required for long-term anaerobiosis. Overall, this study reveals that the acute withdrawal of oxygen can invoke a metabolic state-dependent "stress response" but that acclimatization to oxygen deprivation is a relatively slow process involving complex changes primarily in heme-regulated gene networks.
Figures
Similar articles
-
Metabolic-state-dependent remodeling of the transcriptome in response to anoxia and subsequent reoxygenation in Saccharomyces cerevisiae.Eukaryot Cell. 2006 Sep;5(9):1468-89. doi: 10.1128/EC.00107-06. Eukaryot Cell. 2006. PMID: 16963631 Free PMC article.
-
Comparison of the transcriptomic "stress response" evoked by antimycin A and oxygen deprivation in Saccharomyces cerevisiae.BMC Genomics. 2008 Dec 23;9:627. doi: 10.1186/1471-2164-9-627. BMC Genomics. 2008. PMID: 19105839 Free PMC article.
-
Rsp5 is required for the nuclear export of mRNA of HSF1 and MSN2/4 under stress conditions in Saccharomyces cerevisiae.Genes Cells. 2008 Feb;13(2):105-16. doi: 10.1111/j.1365-2443.2007.01154.x. Genes Cells. 2008. PMID: 18233954
-
Rox1 mediated repression. Oxygen dependent repression in yeast.Adv Exp Med Biol. 2000;475:185-95. Adv Exp Med Biol. 2000. PMID: 10849660 Review.
-
[Alternative ways of stress regulation in cells of Saccharomyces cerevisiae: transcriptional activators Msn2 and Msn4].Tsitologiia. 2009;51(3):271-8. Tsitologiia. 2009. PMID: 19435282 Review. Russian.
Cited by
-
Promoters maintain their relative activity levels under different growth conditions.Mol Syst Biol. 2013 Oct 29;9:701. doi: 10.1038/msb.2013.59. Mol Syst Biol. 2013. PMID: 24169404 Free PMC article.
-
Direct role for the Rpd3 complex in transcriptional induction of the anaerobic DAN/TIR genes in yeast.Mol Cell Biol. 2007 Mar;27(6):2037-47. doi: 10.1128/MCB.02297-06. Epub 2007 Jan 8. Mol Cell Biol. 2007. PMID: 17210643 Free PMC article.
-
The regulation of coenzyme q biosynthesis in eukaryotic cells: all that yeast can tell us.Mol Syndromol. 2014 Jul;5(3-4):107-18. doi: 10.1159/000362897. Mol Syndromol. 2014. PMID: 25126044 Free PMC article.
-
Activity motifs reveal principles of timing in transcriptional control of the yeast metabolic network.Nat Biotechnol. 2008 Nov;26(11):1251-9. doi: 10.1038/nbt.1499. Nat Biotechnol. 2008. PMID: 18953355 Free PMC article.
-
Transcriptional Comparison Investigating the Influence of the Addition of Unsaturated Fatty Acids on Aroma Compounds During Alcoholic Fermentation.Front Microbiol. 2019 May 22;10:1115. doi: 10.3389/fmicb.2019.01115. eCollection 2019. Front Microbiol. 2019. PMID: 31178837 Free PMC article.
References
-
- Aach, J., and G. M. Church. 2001. Aligning gene expression time series with time warping algorithms. Bioinformatics 17:495-508. - PubMed
-
- Alexandre, H., V. Ansanay-Galeote, S. Dequin, and B. Blondin. 2001. Global gene expression during short-term ethanol stress in Saccharomyces cerevisiae. FEBS Lett. 498:98-103. - PubMed
-
- Andreasen, A., and T. Stier. 1953. Anaerobic nutrition of Saccharomyces cerevisiae. I. Ergosterol requirement for growth in a defined medium. J. Cell. Comp. Physiol. 41:23-36. - PubMed
-
- Andreasen, A., and T. Stier. 1954. Anaerobic nutrition of Saccharomyces cerevisiae. II. Unsaturated fatty acid requirement for growth in defined medium. J. Cell. Comp. Physiol. 43:271-281. - PubMed
Publication types
MeSH terms
Substances
Grants and funding
LinkOut - more resources
Full Text Sources
Other Literature Sources
Molecular Biology Databases
Research Materials
Miscellaneous