. 2005 May;25(10):4176-88.
doi: 10.1128/MCB.25.10.4176-4188.2005.

Role of epidermal growth factor receptor signaling in RAS-driven melanoma

Affiliations

Role of epidermal growth factor receptor signaling in RAS-driven melanoma

Nabeel Bardeesy et al. Mol Cell Biol. 2005 May.

Abstract

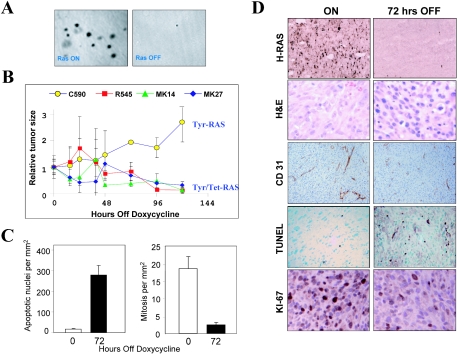
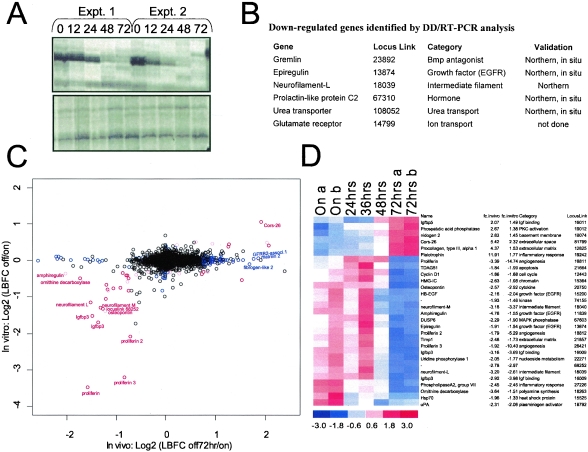
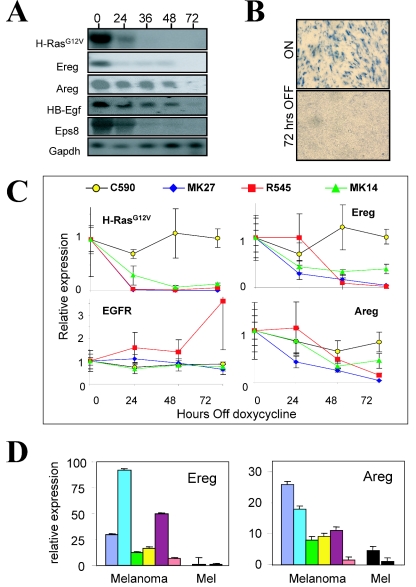
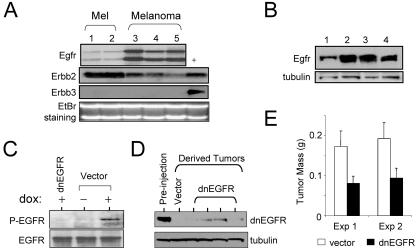
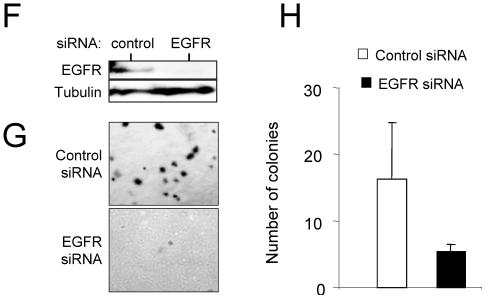
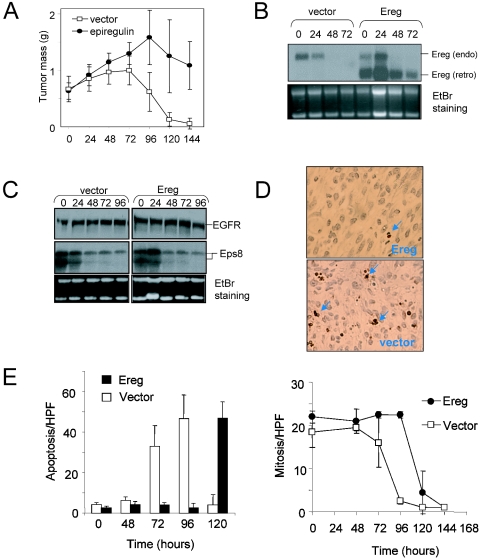
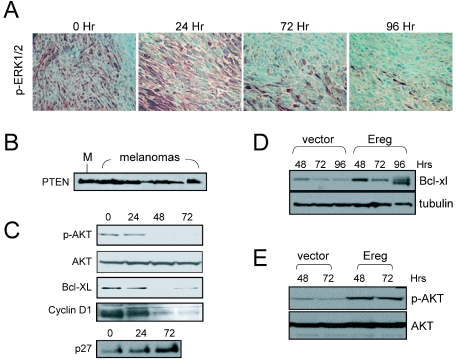
The identification of essential genetic elements in pathways governing the maintenance of fully established tumors is critical to the development of effective antioncologic agents. Previous studies revealed an essential role for H-RAS(V12G) in melanoma maintenance in an inducible transgenic model. Here, we sought to define the molecular basis for RAS-dependent tumor maintenance through determination of the H-RAS(V12G)-directed transcriptional program and subsequent functional validation of potential signaling surrogates. The extinction of H-RAS(V12G) expression in established tumors was associated with alterations in the expression of proliferative, antiapoptotic, and angiogenic genes, a profile consistent with the observed phenotype of tumor cell proliferative arrest and death and endothelial cell apoptosis during tumor regression. In particular, these melanomas displayed a prominent RAS-dependent regulation of the epidermal growth factor (EGF) family, leading to establishment of an EGF receptor signaling loop. Genetic complementation and interference studies demonstrated that this signaling loop is essential to H-RAS(V12G)-directed tumorigenesis. Thus, this inducible tumor model system permits the identification and validation of alternative points of therapeutic intervention without neutralization of the primary genetic lesion.


Figures

FIG. 1.
FIG. 1.
Regression of transplanted melanomas following extinction of H-RASV12G expression. (A) Soft-agar assay of early passage R545 melanoma cells expressing H-RASV12G (on) or not expressing H-RASV12G (off), showing that colony formation is dependent on H-RASV12G activation. (B) Impact of doxycycline withdrawal on tumor size. Early passage melanoma cell lines were injected subcutaneously into SCID mice given doxycycline in the drinking water. After 14 days, doxycycline was removed from the water, and tumors were isolated at the indicated time points following doxycycline withdrawal. Melanomas with an inducible H-RASV12G transgene regress, while the C590 line that constitutively expresses H-RASV12G continues to grow. The data shown are from a representative experiment consisting of four tumors per time point. Comparable results were obtained in multiple repeat experiments. (C) Apoptotic and proliferative indices of tumors from R545 cells at 0 and 72 h following doxycycline withdrawal. (D) Impact of doxycyline withdrawal on tumor histopathology. Tumors from mice on doxycycline (left panels) or 72 h following doxycycline withdrawal (right panels) were analyzed by RNA in situ hybridization for H-RASV12G expression, H&E staining, CD-31 immunostaining to detect vasculature, TUNEL staining to detect apoptosis, and Ki-67 immunostaining to measure proliferation.
FIG. 2.
FIG. 2.
Profiling the H-RASV12G-dependent expression program. (A) Representative DD/RT-PCR analyses of melanomas at successive intervals following doxycycline withdrawal. Upper panel, identification of a down-regulated RT-PCR product. Lower panel, RT-PCR products unchanged during tumor regression. The DD/RT-PCR method uses arbitrary primers to profile expression of numerous mRNAs simultaneously (37). Expt., experiment. (B) Down-regulated genes identified by DD/RT-PCR. (C) Graph comparing genes significantly regulated by H-RASV12G in vivo (x axis) and in vitro (y axis) as determined by microarray analysis (see Materials and Methods). Genes in red are significantly modulated both in vivo and in vitro. Genes in blue are regulated only in vivo. The black circles represent genes without significant expression changes. (D) Genes with alterations in expression in both the in vivo and in vitro data sets. Blue color in 72 h specimens represents decreased expression following doxycycline withdrawal, while red color represents increased expression. The standardized expression values (mean of 0 and standard deviation of 1) for each gene is displayed in a range of from −3 to 3. Expression profiling analysis of two tumors is shown for the On and 72-h time points.
FIG. 3.
FIG. 3.
H-RASV12G-dependent regulation of EGFR signaling. (A) Northern blot analyses showing loss of expression of H-RASV12G and EGFR pathway components in vivo after doxycycline withdrawal. The time (in hours) after doxycycline withdrawal is shown above the lanes. HB-Egf, heparin-binding EGF-like growth factor; Gapdh, glyceraldehyde-3-phosphate dehydrogenase. (B) RNA in situ hybridization showing Ereg expression during tumor regression. (C) Real-time RT-PCR analysis of H-RASV12G, Ereg, Areg, and EGFR expression in melanomas at intervals following doxycycline withdrawal in vivo. The data are from a representative experiment. A second independent experiment showed comparable results. The y axis shows expression relative to time zero expression in the first experiment for each cell line. C590 expresses H-RASV12G constitutively. (D) In vitro measurement of Ereg and Areg expression in a series of independently derived Tyr/Tet-RAS melanoma cell lines grown in the presence of doxycycline (Melanoma) and in cultured melanocytes (Mel) (in the presence [left bar] or absence [right bar] of doxycycline). The y axis shows expression relative to that for cultured melanocytes in the absence of doxycycline (rightmost bar).
FIG. 4.
FIG. 4.
EGFR signaling is required for melanoma tumor maintenance. (A) Northern blot analysis of expression of EGFR family receptors in independent lines of cultured melanocytes (lanes 1 and 2) and independent lines of cultured melanomas from Tyr/Tet-RAS mice (lanes 3 to 5). Lane + contains positive controls for Erbb2 and Erbb3. The ethidium bromide (EtBr)-stained gel is shown as a control for equal loads in the lanes. (B) Immunoblot analysis of EGFR expression in Tyr/Tet-RAS melanomas. (C) Immunoblot analysis of endogenous levels of phospho-EGFR and total EGFR in R545 melanoma cells in vitro. Cells were transduced with dnEGFR or empty vector and grown in the presence (+) or absence (−) of doxycycline (dox). (D) Levels of ectopically expressed dnEGFR in the parental cell line (Pre-injection lane) or in tumors that emerged following injection of these cells in SCID mice (dnEGFR lanes). Lysates for the vector control are shown in the Vector lane. (E) Tumor size 14 days after subcutaneous injection with R545 melanoma cells expressing dnEGFR or empty vector. Eight tumors per time point were analyzed. Exp, experiment. (F) Western blot analysis of R545 cells transfected with control or EGFR siRNA (cell lysates were isolated 72 h posttransfection). (G) Photomicrographs showing soft-agar colony formation by siRNA-transfected R545 cells expressing H-RASV12G. (H) Tabulation of total number of colonies in the soft-agar assay.
FIG. 4.
FIG. 4.
EGFR signaling is required for melanoma tumor maintenance. (A) Northern blot analysis of expression of EGFR family receptors in independent lines of cultured melanocytes (lanes 1 and 2) and independent lines of cultured melanomas from Tyr/Tet-RAS mice (lanes 3 to 5). Lane + contains positive controls for Erbb2 and Erbb3. The ethidium bromide (EtBr)-stained gel is shown as a control for equal loads in the lanes. (B) Immunoblot analysis of EGFR expression in Tyr/Tet-RAS melanomas. (C) Immunoblot analysis of endogenous levels of phospho-EGFR and total EGFR in R545 melanoma cells in vitro. Cells were transduced with dnEGFR or empty vector and grown in the presence (+) or absence (−) of doxycycline (dox). (D) Levels of ectopically expressed dnEGFR in the parental cell line (Pre-injection lane) or in tumors that emerged following injection of these cells in SCID mice (dnEGFR lanes). Lysates for the vector control are shown in the Vector lane. (E) Tumor size 14 days after subcutaneous injection with R545 melanoma cells expressing dnEGFR or empty vector. Eight tumors per time point were analyzed. Exp, experiment. (F) Western blot analysis of R545 cells transfected with control or EGFR siRNA (cell lysates were isolated 72 h posttransfection). (G) Photomicrographs showing soft-agar colony formation by siRNA-transfected R545 cells expressing H-RASV12G. (H) Tabulation of total number of colonies in the soft-agar assay.
FIG. 5.
FIG. 5.
Sustained EGFR signaling partially rescues melanoma survival following extinction of H-RASV12G. (A) R545 cells expressing Ereg or empty vector were injected subcutaneously into SCID mice provided with doxycycline in the drinking water. After 14 days, doxycycline was removed (time zero), and tumors were harvested and weighed at successive time points. Mean tumor mass is represented. Four tumors were analyzed per time point. (B and C) Northern blot analysis of regressing melanomas for expression of Ereg (the bands corresponding to endogenous [endo] and retroviral [retro] Ereg are indicated) (B) and EGFR and Eps8 (C). Ethidium bromide (EtBr)-stained gels were used as loading controls. (D) TUNEL staining (arrows) of apoptotic cells at 72 h following doxycycline withdrawal in control (vector) and Ereg-expressing tumors. (E) Measurement of the apoptotic and mitotic indices of during tumor regression. The apoptosis and mitosis rates per high-power field (HPF) are shown.
FIG. 6.
FIG. 6.
Survival and proliferative pathways in melanoma maintenance. (A) Immunohistochemistry of phospho-ERK1/2 (p-ERK1/2) levels in regressing melanomas. The time (in hours) after doxycycline withdrawal is shown above the panels. (B) Immunoblot showing expression of PTEN in cultured mouse melanocytes (M) and in melanoma cell lines in vitro. (C) Immunoblots of lysates from regressing melanomas for levels of phospho-AKT (p-AKT), total AKT, Bcl-xl, cyclin D1, and p27. (D and E) Constitutive expression of Ereg partially sustains phospho-Akt (D) and Bcl-xl (E) levels. The time (in hours) after doxycycline withdrawal is shown above the lanes in panels C to E.

Similar articles

Cited by

References

    1. Adams, J. 2004. The development of proteasome inhibitors as anticancer drugs. Cancer Cell 5:417-421. - PubMed
    1. Albino, A. P., M. J. Vidal, N. S. McNutt, C. R. Shea, V. G. Prieto, D. M. Nanus, J. M. Palmer, and N. K. Hayward. 1994. Mutation and expression of the p53 gene in human malignant melanoma. Melanoma Res. 4:35-45. - PubMed
    1. Auvinen, M., A. Paasinen, L. C. Andersson, and E. Holtta. 1992. Ornithine decarboxylase activity is critical for cell transformation. Nature 360:355-358. - PubMed
    1. Baguley, B. C., E. S. Marshall, K. M. Holdaway, G. W. Rewcastle, and W. A. Denny. 1998. Inhibition of growth of primary human tumour cell cultures by a 4-anilinoquinazoline inhibitor of the epidermal growth factor receptor family of tyrosine kinases. Eur. J. Cancer 34:1086-1090. - PubMed
    1. Bardeesy, N., B. C. Bastian, A. Hezel, D. Pinkel, R. A. DePinho, and L. Chin. 2001. Dual inactivation of RB and p53 pathways in RAS-induced melanomas. Mol. Cell. Biol. 21:2144-2153. - PMC - PubMed

Publication types

MeSH terms