. 2005 Jul;16(7):3323-33.
doi: 10.1091/mbc.e05-02-0169. Epub 2005 May 4.

Long-term self-renewal of postnatal muscle-derived stem cells

Affiliations

Long-term self-renewal of postnatal muscle-derived stem cells

B M Deasy et al. Mol Biol Cell. 2005 Jul.

Abstract

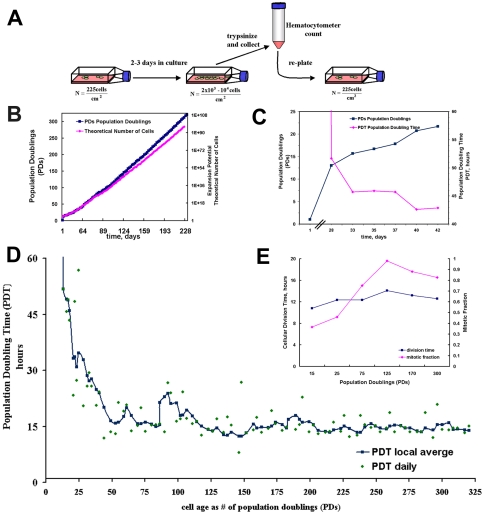
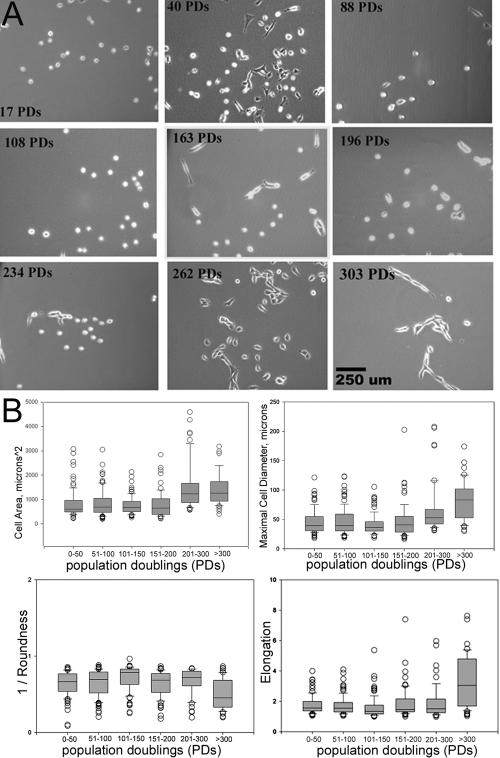
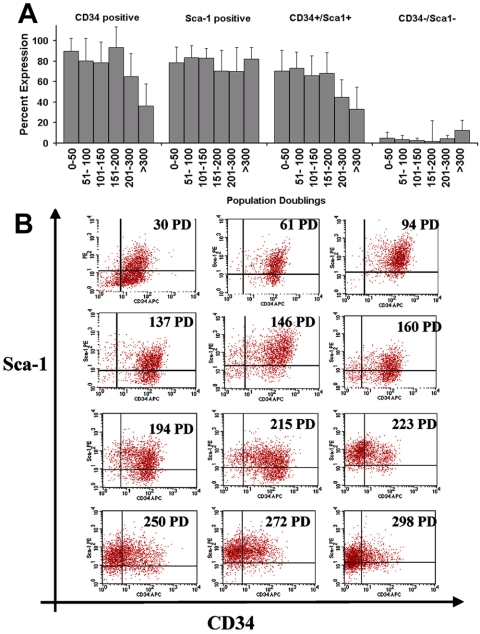
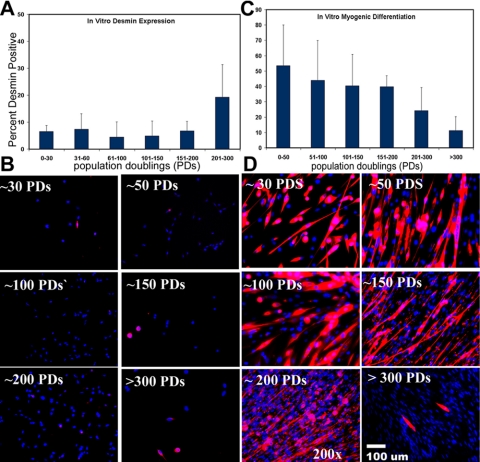
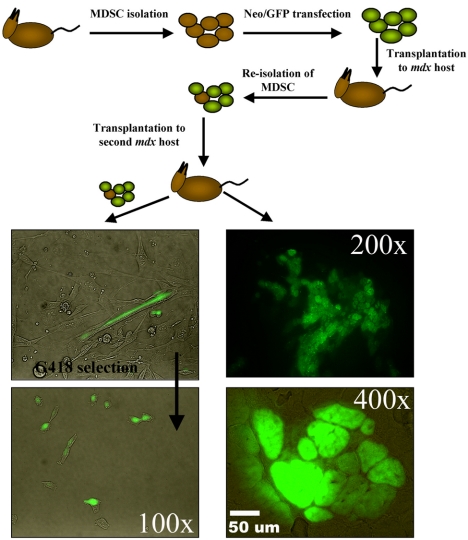
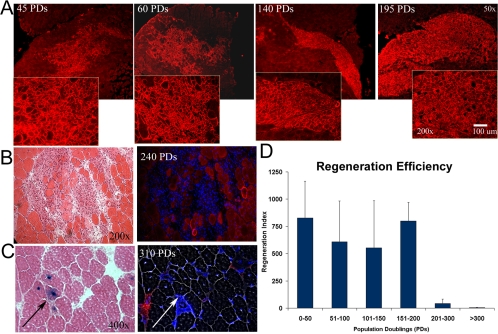
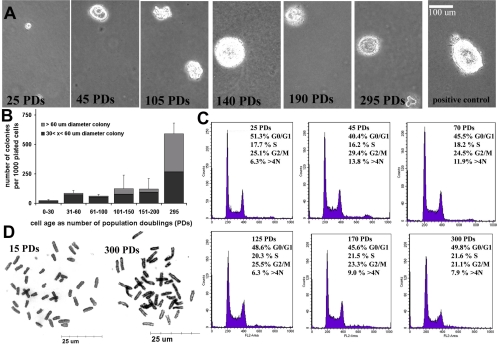
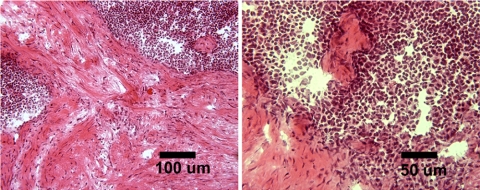
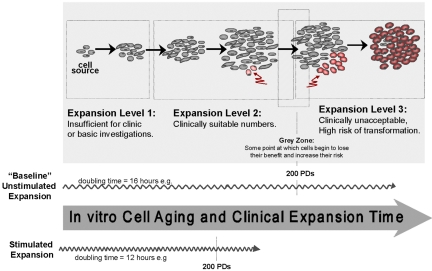
The ability to undergo self-renewal is a defining characteristic of stem cells. Self-replenishing activity sustains tissue homeostasis and regeneration. In addition, stem cell therapy strategies require a heightened understanding of the basis of the self-renewal process to enable researchers and clinicians to obtain sufficient numbers of undifferentiated stem cells for cell and gene therapy. Here, we used postnatal muscle-derived stem cells to test the basic biological assumption of unlimited stem cell replication. Muscle-derived stem cells (MDSCs) expanded for 300 population doublings (PDs) showed no indication of replicative senescence. MDSCs preserved their phenotype (ScaI+/CD34+/desmin(low)) for 200 PDs and were capable of serial transplantation into the skeletal muscle of mdx mice, which model Duchenne muscular dystrophy. MDSCs expanded to this level exhibited high skeletal muscle regeneration comparable with that exhibited by minimally expanded cells. Expansion beyond 200 PDs resulted in lower muscle regeneration, loss of CD34 expression, loss of myogenic activity, and increased growth on soft agar, suggestive of inevitable cell aging attributable to expansion and possible transformation of the MDSCs. Although these results raise questions as to whether cellular transformations derive from cell culturing or provide evidence of cancer stem cells, they establish the remarkable long-term self-renewal and regeneration capacity of postnatal MDSCs.


Figures

Figure 1.
Figure 1.
MDSC expansion. (A) Schematic representation of cell expansion method. Low growth density was maintained by routine passaging every 2 to 3 d. (B) MDSCs in culture were expanded for >300 PDs over a 6-mo period. (C) Closer examination of the cells during the first 6 wk (42 d) showed very slow growth. After ∼4 wk, the number of PDs (blue ▪) was ∼12 and the PDT (red ♦) had dropped to 52 h. Before the 4-wk time point, the average PDT was much longer than 52 h and is not shown on the scale of this graph. After this period, cell death seemed to subside; the PDT at 6 wk was 42 h and the steadily increasing number of PDs had reached ∼22 PDs. (D) Shown are the moving local average PDT (blue ▪, smoothed line) and the individual PDT measurements taken every 2 or 3 d (green ♦). (E) Cellular DT did not change significantly during the expansion. Median division times (blue ▪) are shown for MDSCs expanded for 15 PDs (13 h), 25 PDs (12 h), 75 PDs (14 h), 125 PDs (14 h), 170 PDs (14 h), and 300 PDs (14 h). Mitotic fractions (i.e., the fractions of daughter cells that were actively dividing) (red ♦) for MDSCs expanded for 15 PDs (0.37), 25 PDs (0.46), 75 PDs (0.75), 125 PDs (0.98), 170 PDs (0.88), and 300 PDs (0.83).
Figure 2.
Figure 2.
MDSC morphology. (A) Images illustrate MDSC morphology and the range of cellular densities at particular expansion levels (PDs) throughout the 6-mo period of in vitro expansion (100×; bar, 250 μm) (B) Morphological cellular features of MDSC populations during expansion were measured from phase contrast images. Box plots show the median, 10th, 25th, 75th, and 90th percentiles as vertical boxes with error bars. Highly expanded populations had a significantly larger area and diameter and were less round and more elongated (p < 0.05). Median cross-sectional area is as follows: 0–50 PDs (610 μm2), 51–100 (690 μm2), 101–150 (680 μm2), 151–200 (644 μm2), 201–300 (1230 μm2), and >300 (1260 μm2). Median diameter is as follows: 0–50 PDs (39 μm), 51–100 (39 μm), 101–150 (36 μm2), 151–200 (40 μm), 201–300 (53 μm), and >300 (83 μm). Roundness values are as follows: 0–50 PDs (0.67), 51–100 (0.70), 101–150 (0.78), 151–200 (0.69), 201–300 (0.72), and >300 (0.45). Elongation values are as follows: 0–50 PDs (1.56), 51–100 (1.55), 101–150 (1.35), 151–200 (1.47), 201–300 (1.52), and >300 (3.06).
Figure 3.
Figure 3.
Stem cell marker expression. (A) CD34 and Sca-1 immunophenotyping after expansion. Total percentage of cells expressing CD34 is as follows: 0–50 PDs (85 ± 18; n = 9), 51–100 (81 ± 22; n = 12), 101–150 (78 ± 21%; n = 11), 151–200 (94 ± 7; n = 8), 201–300 (65 ± 22; n = 10), and >300 (37 ± 22; n = 5). Total percentage of cells expressing Sca-1 is as follows: 0–50 PDs (78 ± 15; n = 9), 51–100 (84 ± 12; n = 12), 101–150 (83 ± 9; n = 11), 151–200 (71 ± 17; n = 8), 201–300 (71 ± 23; n = 10), and >300 (76 ± 18; n = 5). The double-positive cell fraction (CD34+/Sca-1+) remained large for the first 200 PDs but significantly decreased in size after 200 PDs. There was no significant difference in the double-negative cell fraction (CD34–/Sca-1–) over time (ANOVA). (B) Flow cytometry dot plots from one representative expansion for 12 different time points throughout the expansion process.
Figure 4.
Figure 4.
Immunochemical analysis of myogenic markers and differentiation. (A) Desmin expression by MDSCs expanded for various numbers of PDs (mean ± SD) is as follows: 0–30 PDs (6.5 ± 2%; n = 3), 31–60 (7.4 ± 7%; n = 4), 61–100 (4.5 ± 7%; n = 8), 101–150 (4.8 ± 5%; n = 5), 151–200 (6.8 ± 4%; n = 6), and 201–300 (19.2 ± 9%; n = 6). (B) Immunochemical staining of MDSCs at the different expansion levels. Desmin, red, Hoechst nuclei, blue (200×). (C) In vitro myogenic differentiation values (as percent myosin heavy chain positive) are as follows: 0–50 PDs (65 ± 4%; n = 4), 51–100 (44 ± 26%; n = 5), 101–150 (40 ± 20%; n = 5), 151–200 (40 ± 7%; n = 5), 201–300 (24 ± 15%; n = 4), and >300 (15 ± 8%; n = 4). ANOVA revealed a significant decrease between both the 201–300 PD time point and the >300 PDs time point compared with all earlier time points (ANOVA; p < 0.05). (D) Immunocytochemical staining for myogenic differentiation into myotubes expressing myosin heavy chain after incubation for 7 d in differentiation-inducing conditions. Myosin heavy chain, red; Hoechst nuclei, blue (200×).
Figure 5.
Figure 5.
In vivo self-renewal. MDSCs were isolated and then were transduced with genes encoding for GFP and neomycin resistance. Two weeks after their injection, the labeled cells were reharvested, selected in G418 medium, and transplanted into secondary mdx recipients. Regeneration of muscle fibers was observed by green fluorescence, whereas contralateral muscles were used to reharvest MDSCs from the secondary recipients. Serially transplanted cells regenerated skeletal muscle fibers within the skeletal muscles of secondary recipients and differentiated into myotubes in vitro.
Figure 6.
Figure 6.
In vivo regeneration efficiency. (A) Regeneration of dystrophin-positive fibers within the skeletal tissue of mdx mice (harvested at 14 d), as indicated by immunostaining (red), by cells at 45, 60, 140, and 195 PDs (50× magnification in background, 200× magnification in foreground). (B) Eosin staining revealed numerous cells in the host mdx muscle transplanted with MDSCs expanded for 240 PDs. Serial sections contained very few dystrophin-positive fibers (200×). (C) LacZ-positive cells (arrows) enabled confirmation of the cell injection site, which serial sections again revealed to be negative for dystrophin (red, Hoechst blue). Image contrast to reveal fibers was performed on serial sections (400×). (D) Dystrophin-expressing muscle fibers present after cell transplantation were scored as the regeneration index (i.e., the number of dystrophin-positive fibers per 100,000 donor cells). Cells expanded for up to 200 PDs engrafted at a level comparable with that exhibited by newly isolated cells; after this point, however, regeneration efficiency dropped significantly (ANOVA; p < 0.05): 0–50 PDs (829 ± 336; n = 4), 51–100 (610 ± 376; n = 3), 101–150 (457 ± 272; n = 6), 151–200 (800 ± 170; n = 4), 201–300 (32 ± 47; n = 4), and >300 (3 ± 2.8; n = 8).
Figure 7.
Figure 7.
(A) Anchorage-independent growth on soft agar. Cells were plated at 2000 cells per 9.6-cm2 well, and images were acquired 21 d after cell seeding. The positive control was the rat 1A cell line. Number of colonies formed per 1000 plated cells: 0–50 PDs (23 ± 10; n = 3), 51–100 (82 ± 24; n = 6), 101–150 (61 ± 13; n = 6), 151–200 (125 ± 116; n = 5), 201–300 (122 ± 88; n = 5), and >300 (590 ± 93; n = 5). The Northern Eclipse software package was used to score both large (>60 μm in diameter) and small colonies (<60 μm). (B) Representative images of colony growth (100×). (C) DNA content analysis by flow cytometry revealed a cell cycle distribution that did not differ significantly among the various doubling levels (ANOVA) with the single exception of the percentage of cells in G2/M at 45 PDs (29 ± 2.5%) compared with the percentage of cells in G2/M at 300 PDs (21 ± 0.6%). (D) Metaphase spreads of MDSCs at 15 PDs and 300 PDs (1000×).
Figure 8.
Figure 8.
Histological examination of in vivo growth observed after transplantation of MDSC-300 PDs into syngeneic mice. Visible are cells with “strap”-like appearance, hypercellular areas containing cells of high nuclear-cytoplasm ratio, and extensive areas of connective tissue formation.
Figure 9.
Figure 9.
In vitro cell aging and clinical expansion of stem cells. Expansion of stem cells will involve generating quantities that are sufficient for basic investigation as well as future therapeutic applications. Identifying and controlling the appropriate expansion and selfrenewal conditions represent a major focus in stem cell biology. It is necessary to know the limit of the expansion as it approaches cell transformation. In the study presented here, MDSC lost their stem cell phenotype after 200 PDs. Stimulated expansion, e.g., cytokine stimulation, can be expected to increase the rate at which a clinical dose is reached and also the rate at which cells may reach their limit.

Similar articles

Cited by

References

    1. Al-Hajj, M., Wicha, M. S., Benito-Hernandez, A., Morrison, S. J., and Clarke, M. F. (2003). Prospective identification of tumorigenic breast cancer cells. Proc. Natl. Acad. Sci. USA 100, 3983–3988. - PMC - PubMed
    1. Amit, M., Carpenter, M. K., Inokuma, M. S., Chiu, C. P., Harris, C. P., Waknitz, M. A., Itskovitz-Eldor, J., and Thomson, J. A. (2000). Clonally derived human embryonic stem cell lines maintain pluripotency and proliferative potential for prolonged periods of culture. Dev. Biol. 227, 271–278. - PubMed
    1. Berghella, L., et al. (1999). Reversible immortalization of human myogenic cells by site-specific excision of a retrovirally transferred oncogene. Hum. Gene Ther. 10, 1607–1617. - PubMed
    1. Bhardwaj, G., Murdoch, B., Wu, D., Baker, D. P., Williams, K. P., Chadwick, K., Ling, L. E., Karanu, F. N., and Bhatia, M. (2001). Sonic hedgehog induces the proliferation of primitive human hematopoietic cells via BMP regulation. Nat. Immunol. 2, 172–180. - PubMed
    1. Bianchi, G., Banfi, A., Mastrogiacomo, M., Notaro, R., Luzzatto, L., Cancedda, R., and Quarto, R. (2003). Ex vivo enrichment of mesenchymal cell progenitors by fibroblast growth factor 2. Exp. Cell Res. 287, 98–105. - PubMed

Publication types

MeSH terms