Comparative Study
. 2005 May 4;25(18):4503-11.
doi: 10.1523/JNEUROSCI.4845-04.2005.

Locus ceruleus control of slow-wave homeostasis

Affiliations
Comparative Study

Locus ceruleus control of slow-wave homeostasis

Chiara Cirelli et al. J Neurosci. .

Abstract

Sleep intensity is regulated by the duration of previous wakefulness, suggesting that waking results in the progressive accumulation of sleep need (Borbely and Achermann, 2000). In mammals, sleep intensity is reflected by slow-wave activity (SWA) in the nonrapid eye movement (NREM) sleep electroencephalogram, which increases in proportion to the time spent awake. However, the mechanisms responsible for the increase of NREM SWA after wakefulness remain unclear. According to a recent hypothesis (Tononi and Cirelli, 2003), the increase in SWA occurs because during wakefulness, many cortical circuits undergo synaptic potentiation, as evidenced by the widespread induction of long-term potentiation (LTP)-related genes in the brain of awake animals. A direct prediction of this hypothesis is that manipulations interfering with the induction of LTP-related genes should result in a blunted SWA response. Here, we examined SWA response in rats in which cortical norepinephrine (NA) was depleted, a manipulation that greatly reduces the induction of LTP-related genes during wakefulness (Cirelli and Tononi, 2004). We found that the homeostatic response of the lower-range SWA was markedly and specifically reduced after NA depletion. These data suggest that the wake-dependent accumulation of sleep need is causally related to cellular changes dependent on NA release, such as the induction of LTP-related genes, and support the hypothesis that sleep SWA homeostasis may be related to synaptic potentiation during wakefulness.


Figures

Figure 1.
Figure 1.
Levels of NA, DA, and 5-HT in the left cerebral cortex of saline-treated rats (c; n = 27) and rats treated effectively with DSP-4 (4; n = 16). NA, DA, and 5-HT were measured using HPLC with electrochemical detection. Values (mean ± SEM) in DSP-4-treated rats are expressed as percentage relative (rel.) to saline-treated controls (100%). NA, 8.8 ± 2.0; DA, 87 ± 20; 5-HT, 83 ± 7. Boxes, Mean ± SEM; open circles, outliers; crosses, extremes. Mann-Whitney U test: NA, p < 0.00001; DA, p = 0.97; 5-HT, p = 0.12.
Figure 2.
Figure 2.
Effects of NA depletion on behavioral states [controls, n = 27; NA depleted (depl.), n = 16]. In this and the following figures, NA-depleted rats are those animals in which NA levels were <10% relative to saline-treated controls. Top, Time course of the amount of wakefulness, NREM sleep, and REM sleep during 24 h of baseline (12 h light/dark condition). Bars represent 6 h mean values (+SEM) expressed as a percentage of recording time. Bottom, Mean absolute EEG power values (μV2/0.5 Hz) of the 24 h baseline during wakefulness, NREM, and REM sleep. Values represent EEG power per 0.5 Hz bin (±SEM) on a logarithmic scale (parietal derivation).
Figure 3.
Figure 3.
Time course of SWA (0.5-4.5 Hz) during NREM sleep after 6 h of sleep deprivation (controls, n = 13; NA depleted, n = 12). Curves connect 1 h mean values (±SEM) of SWA expressed for every individual animal as a percentage of the 24 h baseline mean. Triangles indicate differences between the two experimental groups (p < 0.05; two-tailed unpaired t test after significance in two-way ANOVA).
Figure 4.
Figure 4.
Top, Effects of NA depletion on EEG power density during NREM sleep after 6 h of sleep deprivation (controls, n = 13; NA depleted, n = 12). Curves connect means (±SEM) of relative power density in the first 2 h after sleep deprivation expressed as percentage of power in the same frequency bin during the 24 h baseline. Bottom bars indicate frequency bins for which power in NA-depleted rats was significantly different from control animals (unpaired t test; p < 0.05). Bottom, Time course of the EEG power density in the low-frequency-range (0.5-1.5 Hz) SWA during NREM sleep after 6 h of sleep deprivation (controls, n = 13; NA depleted, n = 12). Curves connect 1 h mean values (±SEM) of SWA expressed for every individual animal as a percentage of the 24 h baseline mean. Triangles indicate differences between the two experimental groups (p < 0.05; two-tailed unpaired t test after significance in two-way ANOVA).
Figure 5.
Figure 5.
Time course of the EEG power density in the low-range (0.5-1.5 Hz) SWA in NREM sleep during baseline (controls, n = 27; NA depleted, n = 16). Curves connect 2 h mean values (±SEM) of SWA expressed for every individual animal as a percentage of the 24 h baseline mean (100%). Triangles indicate differences between the two experimental groups (p < 0.05; two-tailed unpaired t test after significance in two-way ANOVA).
Figure 6.
Figure 6.
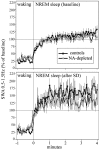
Time course of lower-range SWA (0.5-1.5 Hz) at the transition from wakefulness to NREM sleep for control (n = 13) and NA-depleted (n = 12) rats during baseline sleep (top) and during recovery sleep after sleep deprivation (SD; bottom). The curves connect mean ± SEM 4 s bins for 1 min before and 4 min after the transition. The curves are expressed as a percentage of the baseline 24 h value of the power in NREM sleep for each animal. Mean ± SEM number of transitions per animal: controls, baseline sleep, 21.4 (± 1.7), recovery sleep, 17.1 (± 1.2); NA-depleted rats, baseline sleep, 24.9 (± 4.0), recovery sleep, 15.4 (± 2.7). As a result of the presence of artifacts in some EEG recordings, not all the animals used for Figure 5 could be used for this analysis.
Figure 7.
Figure 7.
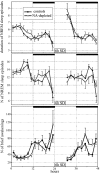
Top and middle, Time course of the duration and number of NREM sleep episodes during baseline and after 6 h of sleep deprivation (SD; controls, n = 13; NA depleted, n = 12). Curves connect 2 h mean values (±SEM). Bottom, Time course of the number of brief awakenings during baseline and after 6 h of sleep deprivation (controls, n = 13; NA depleted, n = 12). The number of brief awakenings is expressed per hour of total sleep. Two-way ANOVAs showed significance for the time interval factor in all three cases (duration and number of NREM sleep episodes, number of brief awakenings), whereas the treatment factor and the treatment by time interval interaction were not significant (see Materials and Methods for details). The number of brief awakenings was still not statistically different between NA-depleted and control rats when computed for the 6 and 12 h periods.

References

    1. Alanko LO, Laitinen JT, Stenberg D, Porkka-Heiskanen T (2004) Adenosine A1 receptor-dependent G-protein activity in the rat brain during prolonged wakefulness. NeuroReport 15: 2133-2137. - PubMed
    1. al-Zahrani SS, al-Ruwaitea AS, Ho MY, Bradshaw CM, Szabadi E (1997) Destruction of central noradrenergic neurones with DSP4 impairs the acquisition of temporal discrimination but does not affect memory for duration in a delayed conditional discrimination task. Psychopharmacology 130: 166-173. - PubMed
    1. Archer T, Mohammed AK, Ross SB, Soderberg U (1983) T-maze learning, spontaneous activity and food intake recovery following systemic administration of the noradrenaline neurotoxin, DSP4. Pharmacol Biochem Behav 19: 121-130. - PubMed
    1. Aston-Jones G, Bloom FE (1981a) Activity of norepinephrine-containing locus coeruleus neurons in behaving rats anticipates fluctuations in the sleep-waking cycle. J Neurosci 1: 876-886. - PMC - PubMed
    1. Aston-Jones G, Bloom FE (1981b) Norepinephrine-containing locus coeruleus neurons in behaving rats exhibit pronounced responses to non-noxious environmental stimuli. J Neurosci 1: 887-900. - PMC - PubMed

Publication types

MeSH terms