. 2005 May;43(5):2133-40.
doi: 10.1128/JCM.43.5.2133-2140.2005.

Evaluation of the COBAS Hepatitis C Virus (HCV) TaqMan analyte-specific reagent assay and comparison to the COBAS Amplicor HCV Monitor V2.0 and Versant HCV bDNA 3.0 assays

Affiliations

Evaluation of the COBAS Hepatitis C Virus (HCV) TaqMan analyte-specific reagent assay and comparison to the COBAS Amplicor HCV Monitor V2.0 and Versant HCV bDNA 3.0 assays

Eric Q Konnick et al. J Clin Microbiol. 2005 May.

Abstract

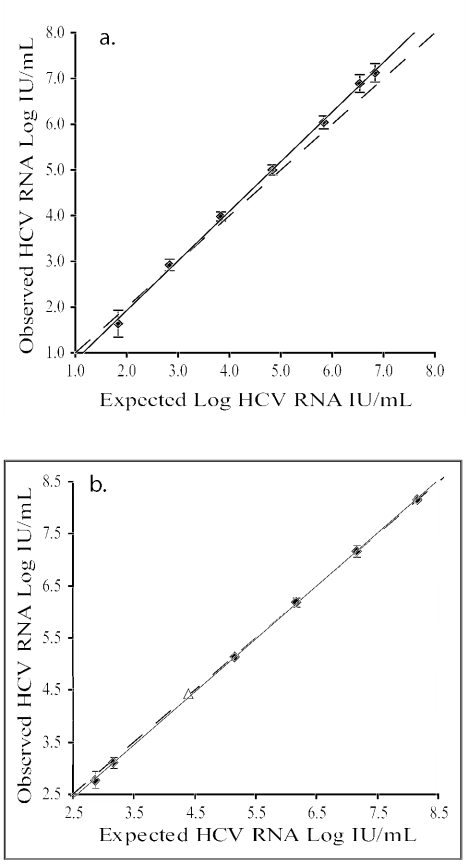
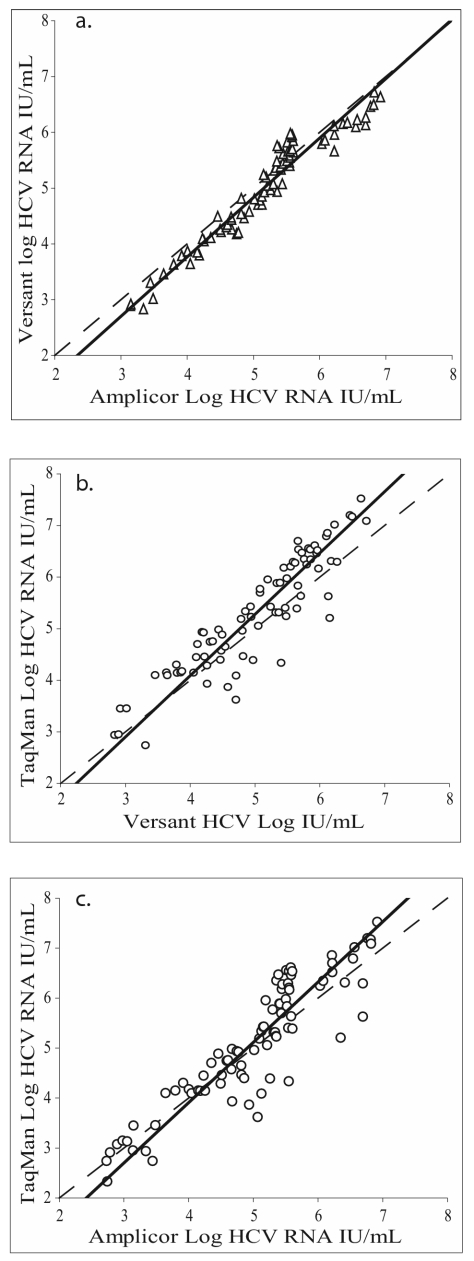
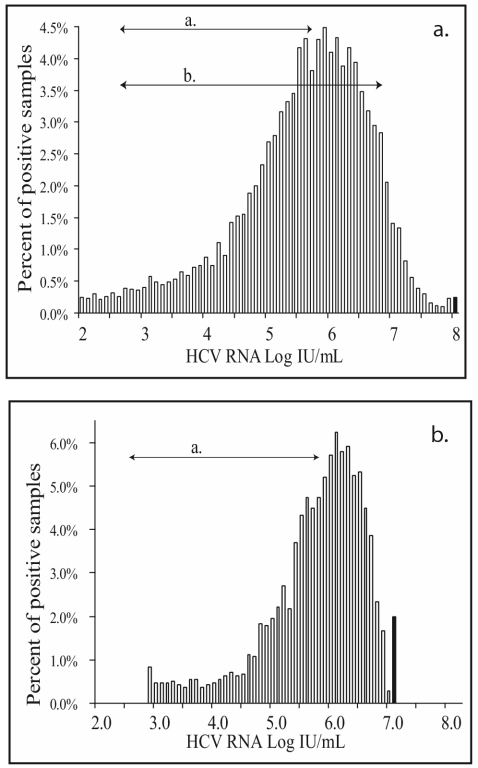
Performance characteristics of the COBAS hepatitis C virus (HCV) TaqMan analyte-specific reagent (TM-ASR) assay using the QIAGEN BioRobot 9604 for RNA extraction were evaluated and compared to the COBAS Amplicor HCV Monitor V2.0 (Amplicor) and Versant HCV bDNA 3.0 (Versant) assays using clinical samples. Calibration of TM-ASR using Armored RNA allowed determination of the distribution of HCV RNA in clinical samples, using 22,399 clinical samples. Limit of detection, linearity, and inter- and intraassay assay precision were determined for the TM-ASR assay using multiple clinical specimen panels across multiple determinations. Genotype specificity for the TM-ASR assay was determined using samples with different HCV RNA genotypes evaluated and compared against predetermined results. Contamination control of the TM-ASR assay was evaluated using pools of HCV RNA-positive and -negative samples tested in a checkerboard pattern over 12 runs of 96 samples. Correlation of the TM-ASR, Amplicor, and Versant assays was determined using 100 paired clinical samples and Deming regression analysis. The TM-ASR performed well with respect to linearity, precision, and contamination control. The correlation between TM-ASR and the Amplicor and Versant assays was poor, with large differences between assay results for individual samples. Calibration of the TM-ASR assay with Armored RNA allowed for a wide dynamic range and description of the distribution of HCV RNA in clinical samples.


Figures

FIG. 1.
FIG. 1.
a. HCV TM-ASR linearity. An eight-member clinical panel (50 to 10,000,000 HCV RNA IU/ml) was processed in replicate using the QIAamp 96 virus kit on the QIAGEN BioRobot 9604 and amplified and detected on the COBAS TaqMan analyzer. Error bars represent 1 standard deviation. The regression equation was observed = 1.086 × (expected) − 0.245 (n = 800; R2 = 0.999). The dashed line represents unity. b. HCV TM-ASR linearity using Armored RNA calibrators. A seven-member dilution series of HCV Armored RNA 1b (<1,000 to >100,000,000 HCV RNA IU/ml) was processed in replicate using the QIAamp 96 virus kit on the QIAGEN BioRobot 9604 and amplified and detected on a COBAS TaqMan analyzer. The solid symbols (▪) represent the average of the replicate Armored RNA dilutions, and the open symbol (Δ) represents the average of four replicates of a 1:4 dilution of the WHO HCV RNA second international standard 2003 (96/798). Error bars represent 1 standard deviation. The regression equation was observed = 1.02 × (expected) − 0.108 (R2 = 0.999; n = 56). The dashed line represents unity.
FIG. 2.
FIG. 2.
a. COBAS Amplicor HCV Monitor V2.0 and Versant HCV bDNA 3.0 correlation. Assay correlation was determined by processing 100 clinical samples by the COBAS Amplicor HCV Monitor V2.0 andVersant HCV bDNA 3.0 assays. Deming regression was Versant = 1.065 × (Amplicor) − 0.446 (R2 = 0.939; n = 80; SEE = 0.239). The dashed line represents unity. b. COBAS HCV TM-ASR and Versant HCV bDNA 3.0 (Versant) correlation. Assay correlation was determined by processing 100 clinical samples by the TM-ASR and Versant assays. Deming regression equation: TM-ASR = 1.188 × (Versant) − 0.663 (R2 = 0.829; n = 80; SEE = 0.473). The dashed line represents unity. c. COBAS HCV TM-ASR and COBAS Amplicor HCV Monitor V2.0 (Amplicor) correlation. Assay correlation was determined by processing 100 clinical samples by the TM-ASR and Amplicor assays. Deming regression: TM-ASR = 1.207 × (Amplicor) − 0.919 (R2 = 0.818; n = 86; SEE = 0.544). The dashed line represents unity.
FIG. 3.
FIG. 3.
a. COBAS HCV TM-ASR positive sample distribution. Data from 22,399 samples tested with the TM-ASR assay using calibration coefficients generated using Armored RNA and valid to a concentration of 143,000,000 HCV RNA IU/ml were plotted. Results presented include only samples with quantitative results greater than 100 IU/ml, stratified into 0.1-log IU/ml increments; results from 9,632 (43.0%) samples with results less than 100 IU/ml are not included. The arrows represent the predicted analytical measurement ranges of the COBAS Amplicor HCV Monitor V2.0 (arrow a) and Versant HCV bDNA 3.0 (arrow b) assays. The solid bar represents samples with results greater than log 8.0 HCV RNA IU/ml. b. Versant HCV bDNA 3.0 (Versant) positive sample distribution. Data from 4,037 samples tested with the Versant assay as per the manufacturer's instructions are presented. Results presented include only samples with quantitative results or results greater than 8,000,000 HCV RNA IU/ml, stratified into 0.1-log IU/ml increments, with results from 1,518 (37.6%) samples with results less than 615 IU/ml not included. The arrow represents the predicted analytical measurement range of the COBAS Amplicor HCV Monitor V2.0 assay. The solid bar represents samples with results greater than log 6.9 HCV RNA IU/ml.

References

    1. Barbeau, J. M., J. Goforth, A. M. Caliendo, and F. S. Nolte. 2004. Performance characteristics of a quantitative TaqMan hepatitis C virus RNA analyte-specific reagent. J. Clin. Microbiol. 42:3739-3746. - PMC - PubMed
    1. Dufour, D. R., J. A. Lott, F. S. Nolte, D. R. Gretch, R. S. Koff, and L. B. Seeff. 2000. Diagnosis and monitoring of hepatic injury. I. Performance characteristics of laboratory tests. Clin. Chem. 46:2027-2049. - PubMed
    1. Elbeik, T., J. Surtihadi, M. Destree, J. Gorlin, M. Holodniy, S. A. Jortani, K. Kuramoto, V. Ng, R. Valdes, Jr., A. Valsamakis, and N. A. Terrault. 2004. Multicenter evaluation of the performance characteristics of the bayer VERSANT HCV RNA 3.0 assay (bDNA). J. Clin. Microbiol. 42:563-569. - PMC - PubMed
    1. Forman, M. S., and A. Valsamakis. 2004. Verification of an assay for quantification of hepatitis C virus RNA by use of an analyte-specific reagent and two different extraction methods. J. Clin. Microbiol. 42:3581-3588. - PMC - PubMed
    1. Fried, M. W., M. L. Shiffman, K. R. Reddy, C. Smith, G. Marinos, F. L. Goncales, Jr., D. Haussinger, M. Diago, G. Carosi, D. Dhumeaux, A. Craxi, A. Lin, J. Hoffman, and J. Yu. 2002. Peginterferon alfa-2a plus ribavirin for chronic hepatitis C virus infection. N. Engl. J. Med. 347:975-982. - PubMed

Publication types

MeSH terms

LinkOut - more resources