

Three microarray platforms: an analysis of their concordance in profiling gene expression
- PMID: 15876355
- PMCID: PMC1140753
- DOI: 10.1186/1471-2164-6-63
Three microarray platforms: an analysis of their concordance in profiling gene expression
Abstract
Background: Microarrays for the analysis of gene expression are of three different types: short oligonucleotide (25-30 base), long oligonucleotide (50-80 base), and cDNA (highly variable in length). The short oligonucleotide and cDNA arrays have been the mainstay of expression analysis to date, but long oligonucleotide platforms are gaining in popularity and will probably replace cDNA arrays. As part of a validation study for the long oligonucleotide arrays, we compared and contrasted expression profiles from the three formats, testing RNA from six different cell lines against a universal reference standard.
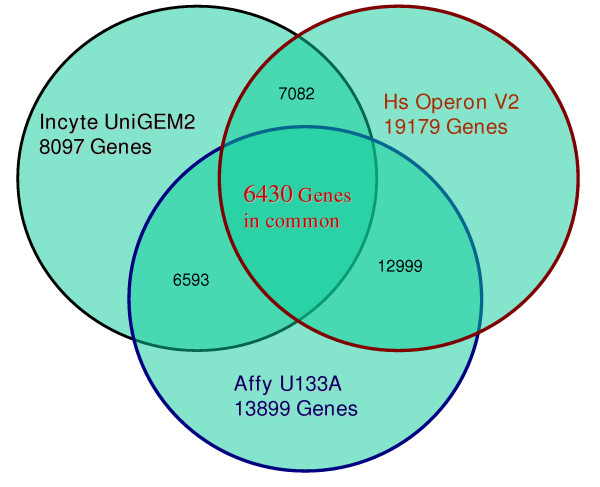
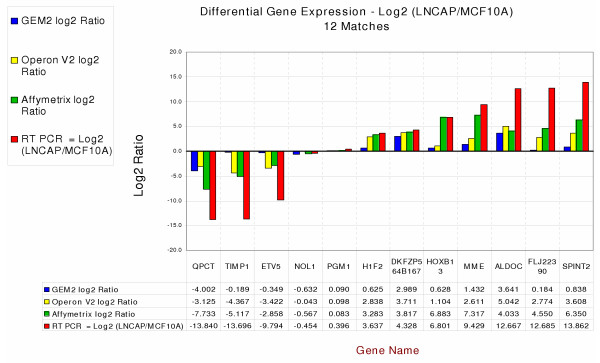
Results: The three platforms had 6430 genes in common. In general, correlation of gene expression levels across the platforms was good when defined by concordance in the direction of expression difference (upregulation or downregulation), scatter plot analysis, principal component analysis, cell line correlation or quantitative RT-PCR. The overall correlations (r values) between platforms were in the range 0.7 to 0.8, as determined by analysis of scatter plots. When concordance was measured for expression ratios significant at p-values of <0.05 and at expression threshold levels of 1.5 and 2-fold, the agreement among the platforms was very high, ranging from 93% to 100%.
Conclusion: Our results indicate that the long oligonucleotide platform is highly suitable for expression analysis and compares favorably with the cDNA and short oligonucleotide varieties. All three platforms can give similar and reproducible results if the criterion is the direction of change in gene expression and minimal emphasis is placed on the magnitude of change.
Figures


Similar articles
-
Dissecting tBHQ induced ARE-driven gene expression through long and short oligonucleotide arrays.Physiol Genomics. 2005 Mar 21;21(1):43-58. doi: 10.1152/physiolgenomics.00214.2004. Epub 2004 Dec 21. Physiol Genomics. 2005. PMID: 15613614
-
Redefinition of Affymetrix probe sets by sequence overlap with cDNA microarray probes reduces cross-platform inconsistencies in cancer-associated gene expression measurements.BMC Bioinformatics. 2005 Apr 25;6:107. doi: 10.1186/1471-2105-6-107. BMC Bioinformatics. 2005. PMID: 15850491 Free PMC article.
-
Comparison of gene expression measurements from cDNA and 60-mer oligonucleotide microarrays.Genomics. 2005 Jun;85(6):657-65. doi: 10.1016/j.ygeno.2005.02.012. Genomics. 2005. PMID: 15885493
-
Improving reliability and performance of DNA microarrays.Expert Rev Mol Diagn. 2006 May;6(3):481-92. doi: 10.1586/14737159.6.3.481. Expert Rev Mol Diagn. 2006. PMID: 16706748 Review.
-
Technological platforms for microarray gene expression profiling.Adv Exp Med Biol. 2007;593:12-8. doi: 10.1007/978-0-387-39978-2_2. Adv Exp Med Biol. 2007. PMID: 17265712 Review.
Cited by
-
Dysregulated molecular networks in head and neck carcinogenesis.Oral Oncol. 2009 Apr-May;45(4-5):324-34. doi: 10.1016/j.oraloncology.2008.07.011. Epub 2008 Sep 19. Oral Oncol. 2009. PMID: 18805044 Free PMC article. Review.
-
Microarray probes and probe sets.Front Biosci (Elite Ed). 2010 Jan 1;2(1):325-38. doi: 10.2741/e93. Front Biosci (Elite Ed). 2010. PMID: 20036881 Free PMC article. Review.
-
Cross platform microarray analysis for robust identification of differentially expressed genes.BMC Bioinformatics. 2007 Mar 8;8 Suppl 1(Suppl 1):S5. doi: 10.1186/1471-2105-8-S1-S5. BMC Bioinformatics. 2007. PMID: 17430572 Free PMC article.
-
Characterization of a newly developed chicken 44K Agilent microarray.BMC Genomics. 2008 Jan 31;9:60. doi: 10.1186/1471-2164-9-60. BMC Genomics. 2008. PMID: 18237426 Free PMC article.
-
Mechanisms and Measurement of Changes in Gene Expression.Biol Res Nurs. 2018 Jul;20(4):369-382. doi: 10.1177/1099800418772161. Epub 2018 Apr 29. Biol Res Nurs. 2018. PMID: 29706088 Free PMC article.
References
-
- Schena M, Shalon D, Davis RW, Brown PO. Quantitative monitoring of gene expression patterns with a complementary DNA microarray. Science. 1995;270:368–371. - PubMed
-
- Blanchard AP, Kaiser RJ, Hood LE. High density oligonucleotide arrays. Biosens Bioelectron. 1996;11:687–690. doi: 10.1016/0956-5663(96)83302-1. - DOI
MeSH terms
Substances
LinkOut - more resources
Full Text Sources
Research Materials
