

Tissue targeted metabonomics: metabolic profiling by microdialysis sampling and microcoil NMR
- PMID: 15876508
- PMCID: PMC2519806
- DOI: 10.1016/j.jpba.2005.02.034
Tissue targeted metabonomics: metabolic profiling by microdialysis sampling and microcoil NMR
Abstract
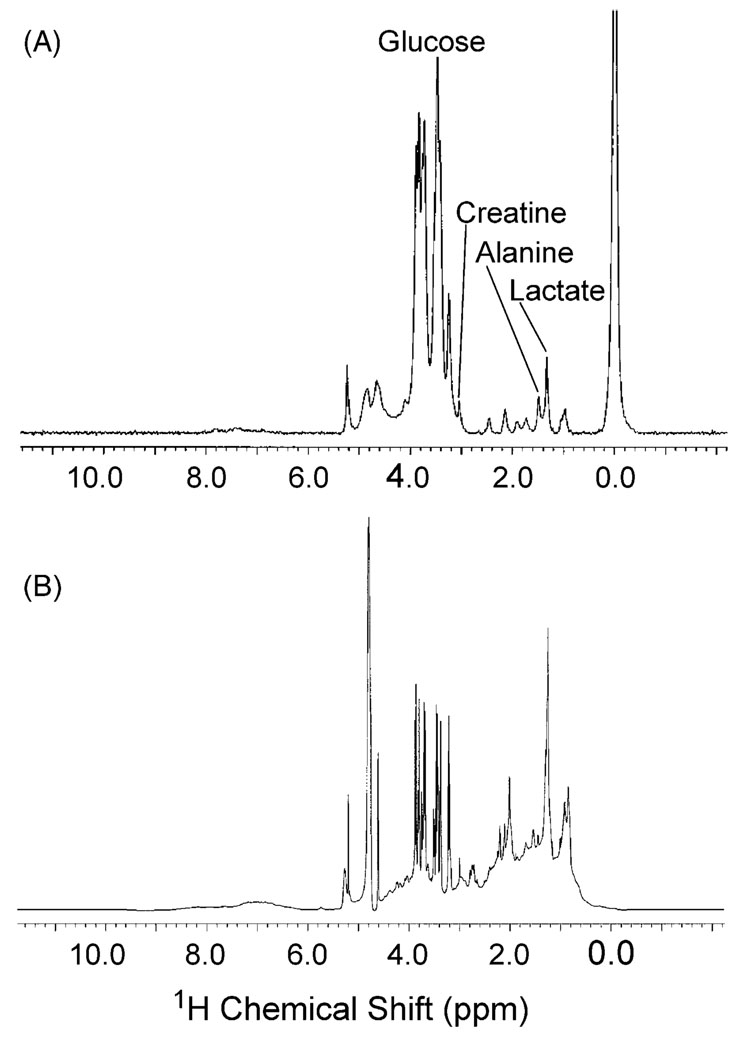
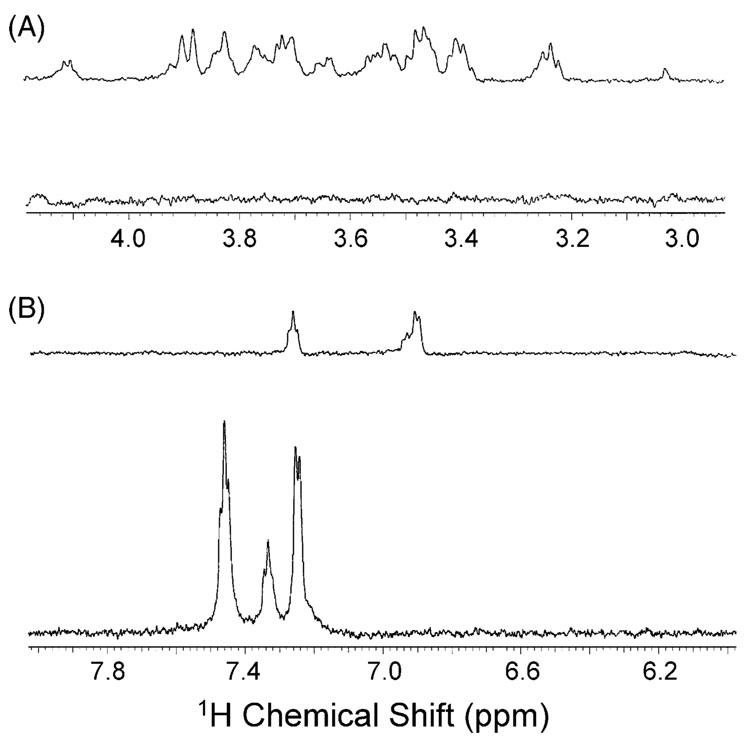
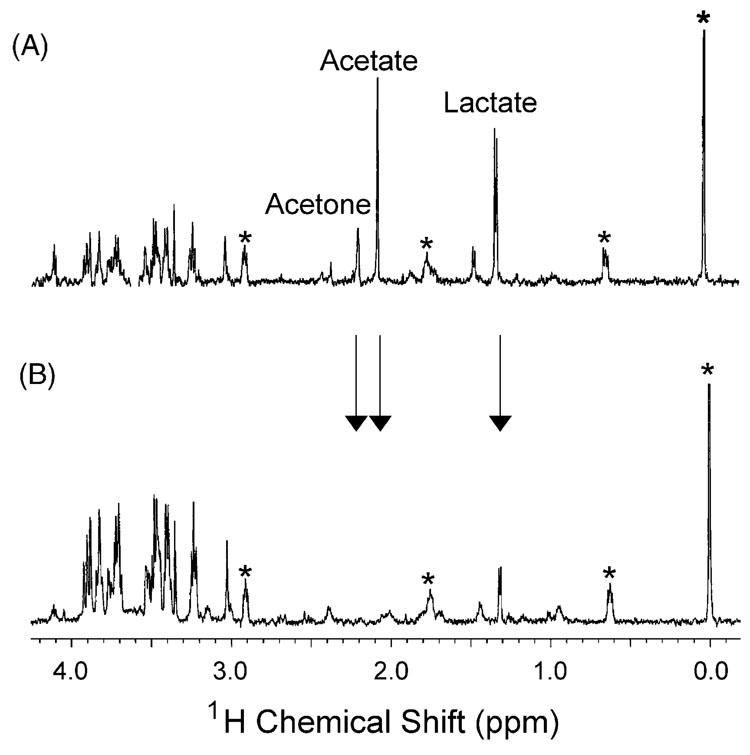
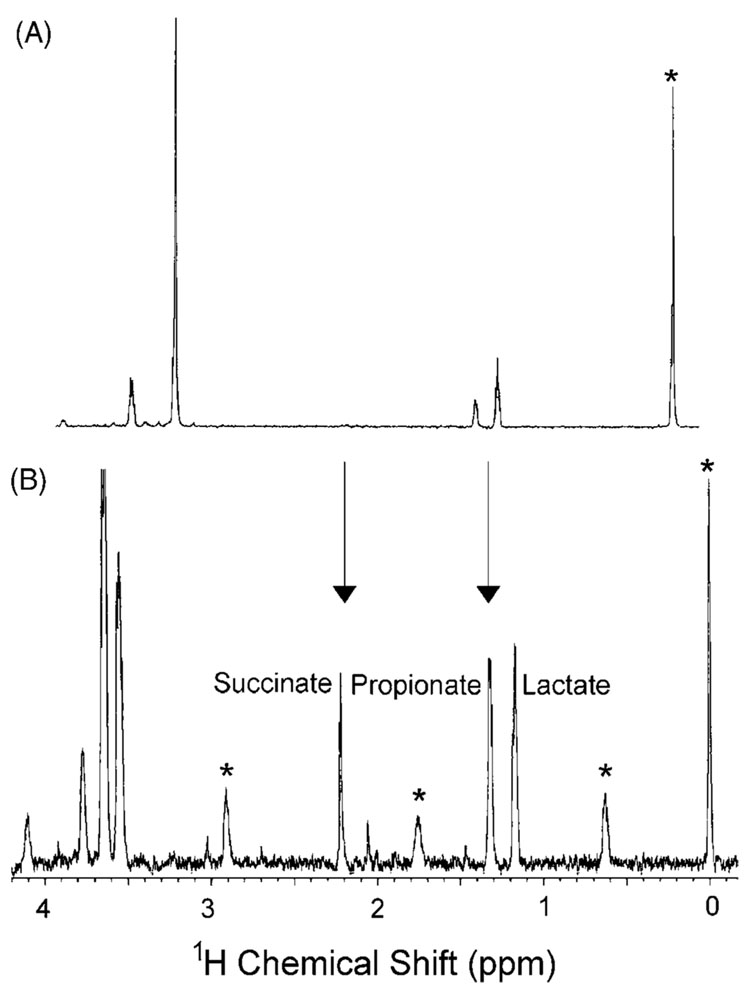
The concentration of low molecular weight compounds in tissues can yield valuable information about the metabolic state of an organism. Studies of changes in the metabolic state or metabonomics can reflect disease pathways, drug action, or toxicity. This research aims to develop a new approach, tissue targeted metabonomics. Microdialysis sampling and microcoil NMR analysis are employed to compare basal and ischemic metabolic states of various tissues (blood, brain, and heart) of Sprague-Dawley rats. Microdialysis sampling is localized, making the metabolic profile tissue specific. Coupling to NMR analysis is highly advantageous, because a complete metabolic profile is obtained in a single spectrum. However, small sample volumes and low analyte concentrations make analysis of microdialysis samples challenging. Microcoil NMR uses low sample volumes and has improved mass sensitivity, relative to standard 5 mm probes. The coupling of these techniques is a potentially powerful tool for metabonomics analysis.
Figures
Similar articles
-
Development of tissue-targeted metabonomics. Part 1. Analytical considerations.J Pharm Biomed Anal. 2008 Mar 13;46(4):737-47. doi: 10.1016/j.jpba.2007.11.035. Epub 2007 Nov 29. J Pharm Biomed Anal. 2008. PMID: 18191359 Free PMC article.
-
Extracellular adenosine levels and cellular energy metabolism in ischemically preconditioned rat heart.Cardiovasc Res. 1998 Oct;40(1):74-87. doi: 10.1016/s0008-6363(98)00123-0. Cardiovasc Res. 1998. PMID: 9876319
-
A simple blood microdialysis in freely-moving rats for pharmacokinetic-pharmacodynamic modeling study of Shengmai injection with simultaneous determination of drug concentrations and efficacy levels in dialysate.J Pharm Biomed Anal. 2018 May 30;154:23-30. doi: 10.1016/j.jpba.2018.02.061. Epub 2018 Mar 9. J Pharm Biomed Anal. 2018. PMID: 29529491
-
Translational Metabolomics of Head Injury: Exploring Dysfunctional Cerebral Metabolism with Ex Vivo NMR Spectroscopy-Based Metabolite Quantification.In: Kobeissy FH, editor. Brain Neurotrauma: Molecular, Neuropsychological, and Rehabilitation Aspects. Boca Raton (FL): CRC Press/Taylor & Francis; 2015. Chapter 25. In: Kobeissy FH, editor. Brain Neurotrauma: Molecular, Neuropsychological, and Rehabilitation Aspects. Boca Raton (FL): CRC Press/Taylor & Francis; 2015. Chapter 25. PMID: 26269925 Free Books & Documents. Review.
-
Sensitive targeted methods for brain metabolomic studies in microdialysis samples.J Pharm Biomed Anal. 2018 Nov 30;161:192-205. doi: 10.1016/j.jpba.2018.08.043. Epub 2018 Aug 23. J Pharm Biomed Anal. 2018. PMID: 30170201 Review.
Cited by
-
Breast tumor microenvironment: proteomics highlights the treatments targeting secretome.J Proteome Res. 2008 Apr;7(4):1379-87. doi: 10.1021/pr700745n. Epub 2008 Feb 22. J Proteome Res. 2008. PMID: 18290608 Free PMC article. Review.
-
Metabonomics techniques and applications to pharmaceutical research & development.Pharm Res. 2006 Jun;23(6):1075-88. doi: 10.1007/s11095-006-0025-z. Epub 2006 May 25. Pharm Res. 2006. PMID: 16715371 Review.
-
Development of tissue-targeted metabonomics. Part 1. Analytical considerations.J Pharm Biomed Anal. 2008 Mar 13;46(4):737-47. doi: 10.1016/j.jpba.2007.11.035. Epub 2007 Nov 29. J Pharm Biomed Anal. 2008. PMID: 18191359 Free PMC article.
-
NMR-Based Chromatography Readouts: Indispensable Tools to "Translate" Analytical Features into Molecular Structures.Cells. 2022 Nov 7;11(21):3526. doi: 10.3390/cells11213526. Cells. 2022. PMID: 36359922 Free PMC article. Review.
-
Metabolomics, a New Promising Technology for Toxicological Research.Toxicol Res. 2009 Jun;25(2):59-69. doi: 10.5487/TR.2009.25.2.059. Epub 2009 Jun 1. Toxicol Res. 2009. PMID: 32038821 Free PMC article. Review.
References
-
- Lindon JC, Holmes E, Nicholson JK. Anal. Chem. 2003;75:384A–391A. - PubMed
-
- Nicholson JK, Lindon JC, Holmes E. Xenobiotica. 1999;29:1181–1189. - PubMed
-
- Reily MD, Robertson DG, Delnomdedieu M, Baker JD. Am. Pharm. Rev. 2003;6:105–109.
-
- Robertson DG, Bulera SJ. Curr. Opin. Drug Discov. Dev. 2000;3:42–47. - PubMed
-
- Lindon JC, Holmes E, Bollard ME, Stanley EG, Nicholson JK. Biomarkers. 2004;9:1–31. - PubMed
Publication types
MeSH terms
Grants and funding
LinkOut - more resources
Full Text Sources
Other Literature Sources
