Review
. 2005 May;1(5):335-46.
doi: 10.1155/2005/509646.

Identification of replication origins in archaeal genomes based on the Z-curve method

Affiliations
Review

Identification of replication origins in archaeal genomes based on the Z-curve method

Ren Zhang et al. Archaea. 2005 May.

Abstract

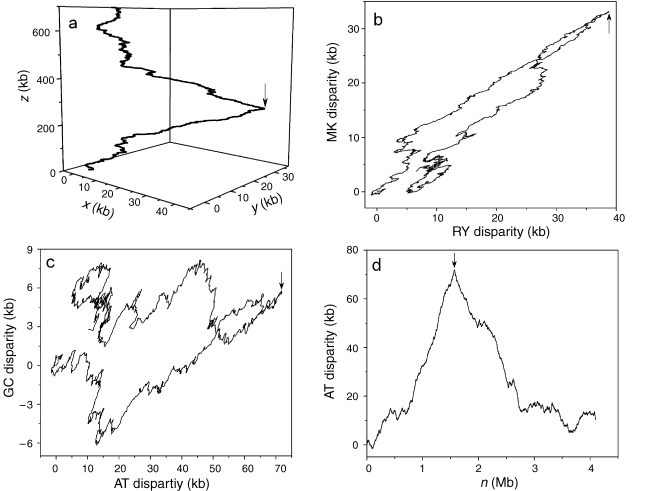
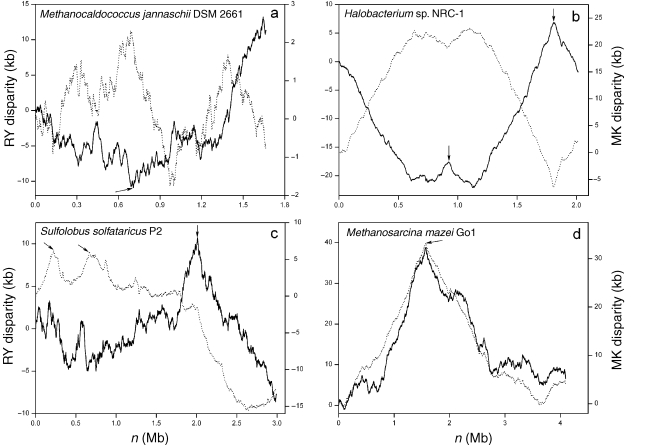
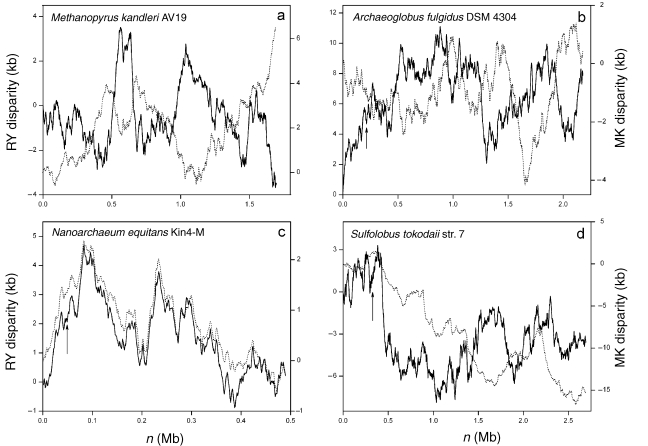
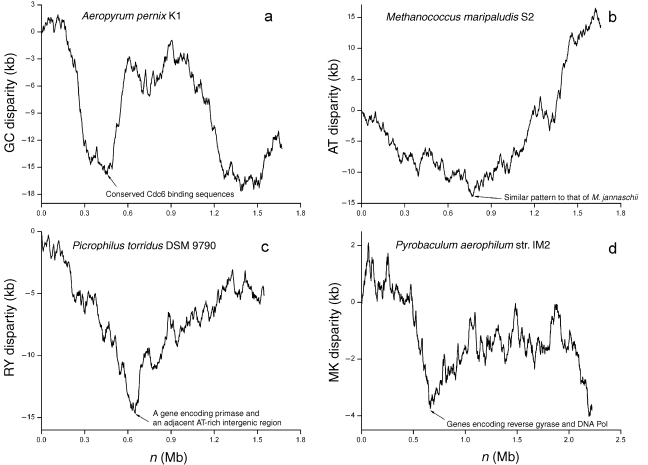
The Z-curve is a three-dimensional curve that constitutes a unique representation of a DNA sequence, i.e., both the Z-curve and the given DNA sequence can be uniquely reconstructed from the other. We employed Z-curve analysis to identify one replication origin in the Methanocaldococcus jannaschii genome, two replication origins in the Halobacterium species NRC-1 genome and one replication origin in the Methanosarcina mazei genome. One of the predicted replication origins of Halobacterium species NRC-1 is the same as a replication origin later identified by in vivo experiments. The Z-curve analysis of the Sulfolobus solfataricus P2 genome suggested the existence of three replication origins, which is also consistent with later experimental results. This review aims to summarize applications of the Z-curve in identifying replication origins of archaeal genomes, and to provide clues about the locations of as yet unidentified replication origins of the Aeropyrum pernix K1, Methanococcus maripaludis S2, Picrophilus torridus DSM 9790 and Pyrobaculum aerophilum str. IM2 genomes.


Figures

Figure 1.
Figure 1.
The Z-curves for the Methanosarcina mazei genome. (a) The 3-D Z-curve, (b) the 2-D Z-curve based on RY and MK disparity, (c) the 2-D Z-curve based on AT and GC disparity and (d) the AT disparity curves. Arrows indicate the positions of the cdc6 gene, which is also the position of the predicted replication origin.
Figure 2.
Figure 2.
The Z-curves for the genomes of (a) Methanocaldococcus jannaschii DSM 2661, (b) Halobacterium sp. NRC-1, (c) Sulfolobus solfataricus P2 and (d) Methanosarcina mazei Go1. Unbroken lines denote RY disparity curves, and broken lines denote MK disparity curves. Arrows indicate the positions of cdc6 genes, which are also the positions of predicted replication origins. In the Halobacterium sp. NRC-1 genome, Berquist and DasSarma (2003) have identified a chromosomal autonomously replicating sequence element, which is at the location of the cdc6-3 (arrow at about 1.8 Mb). Robinson et al. (2004) have identified two replication origins in the S. solfataricus genome in vivo. The two replication origins, oriC1 and oriC2, are close to cdc6-1 and cdc6-3, respectively (the positions of the first and third arrows).
Figure 3.
Figure 3.
The Z-curves for the genomes of (a) Methanopyrus kandleri AV19, (b) Archaeoglobus fulgidus DSM 4304, (c) Nanoarchaeum equitans Kin4-M and (d) Sulfolobus tokodaii str. 7. Among the 19 available archaeal genomes, the Z-curves for these four genomes show a complex pattern, with no clear global minima or maxima. Unbroken lines denote RY disparity curves, and broken lines denote MK disparity curves. Arrows indicate the positions of cdc6 genes in the A. fulgidus, N. equitans and S. tokodaii genomes. The approximate location of the replication origin of A. fulgidus was suggested to be at about the middle of the chromosome based on marker frequency analysis.
Figure 4.
Figure 4.
The Z-curve analysis for the genomes of Aeropyrum pernix K1, Methanococcus maripaludis S2, Picrophilus torridus DSM 9790 and Pyrobaculum aerophilum str. IM2, in which replication origins are unknown. (a) The GC disparity curve for the A. pernix K1 genome. Some conserved Cdc6 binding sequences are located at a minimum. (b) The AT disparity curve for the M. maripaludis S2 genome. The AT disparity curve shows a global minimum, suggesting the existence of a replication origin around this site. In addition, the overall pattern of the AT disparity curve is similar to the RY disparity curve of the M. jannaschii genome. Compare Figure 4b with Figure 2a. (c) The RY disparity curve for the P. torridus DSM 9790 genome. A DNA primase gene (PTO0617) is located at the site of the global minimum. In addition, immediately beside this primase gene, a 174 bp intergenic sequence between the ORF PTO0617 and PTO0616 is highly rich in AT content (81.1%). (d) The MK disparity curve for the P. aerophilum str. IM2 genome. Genes coding for reverse gyrase and DNA polymerase are located at a minimum. The presence of Cdc6 binding elements, AT-rich intergenic sequence, or replication-associated genes at one of the Z-curve extremes provides additional clues for potential candidate regions that may contain replication origins.

References

    1. Bernander R. Chromosome replication, nucleoid segregation and cell division in archaea. Trends Microbiol. 2000;8:278–283. - PubMed
    1. Bernander R. The archaeal cell cycle: current issues. Mol. Microbiol. 2003;48:599–604. - PubMed
    1. Berquist B.R., DasSarma S. An archaeal chromosomal autonomously replicating sequence element from an extreme halophile, Halobacterium sp. strain NRC-1. J. Bacteriol. 2003;185:5959–5966. - PMC - PubMed
    1. Bohlke K., Pisani F.M., Rossi M., Antranikian G. Archaeal DNA replication: spotlight on a rapidly moving field. Extremophiles. 2002;6:1–14. - PubMed
    1. Brochier C., Forterre P., Gribaldo S. Archaeal phylogeny based on proteins of the transcription and translation machineries: tackling the Methanopyrus kandleri paradox. Genome Biol. 2004;5:R17. - PMC - PubMed

Publication types

LinkOut - more resources