. 2005 May 6:6:112.
doi: 10.1186/1471-2105-6-112.

Confirmation of human protein interaction data by human expression data

Affiliations

Confirmation of human protein interaction data by human expression data

Andreas Hahn et al. BMC Bioinformatics. .

Abstract

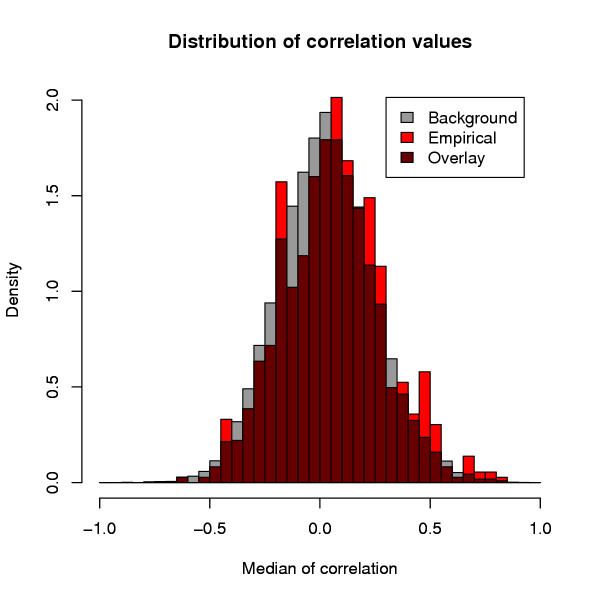
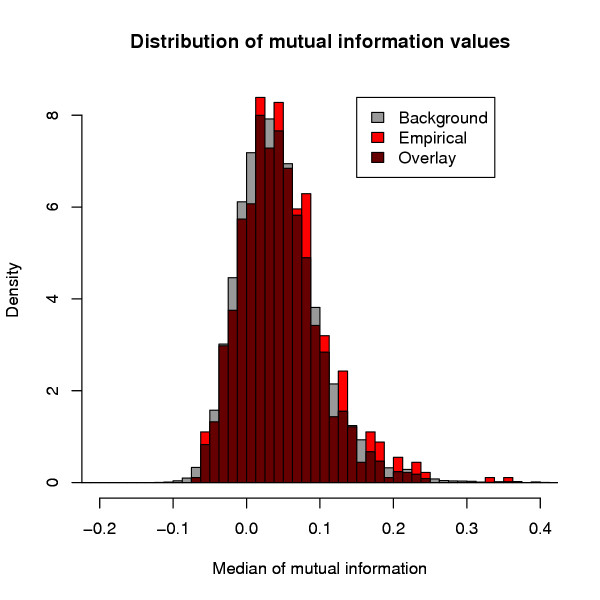
Background: With microarray technology the expression of thousands of genes can be measured simultaneously. It is well known that the expression levels of genes of interacting proteins are correlated significantly more strongly in Saccharomyces cerevisiae than those of proteins that are not interacting. The objective of this work is to investigate whether this observation extends to the human genome.

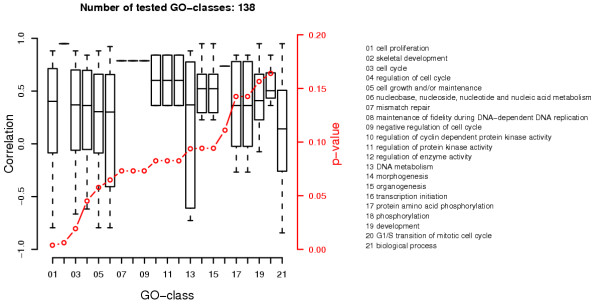
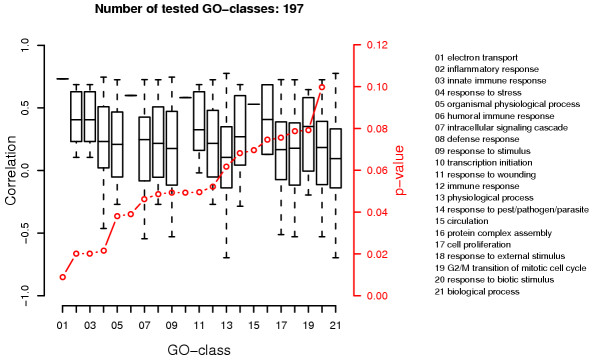
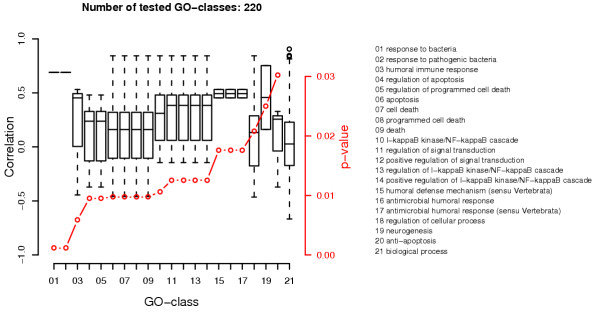
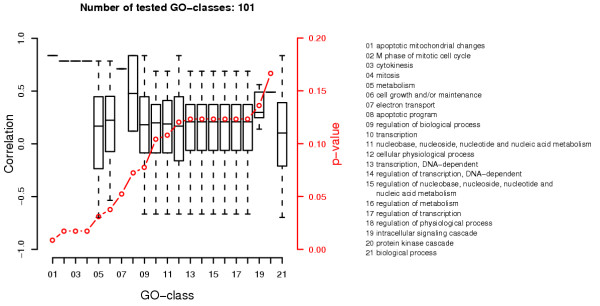
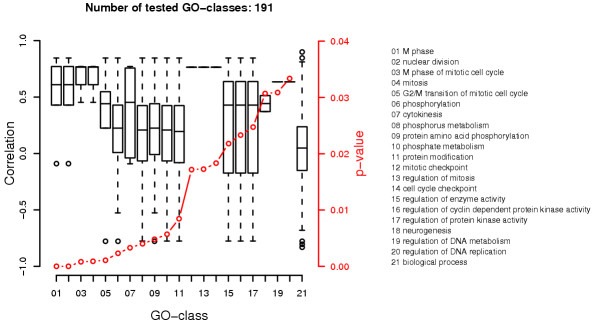
Results: We investigated the quantitative relationship between expression levels of genes encoding interacting proteins and genes encoding random protein pairs. Therefore we studied 1369 interacting human protein pairs and human gene expression levels of 155 arrays. We were able to establish a statistically significantly higher correlation between the expression levels of genes whose proteins interact compared to random protein pairs. Additionally we were able to provide evidence that genes encoding proteins belonging to the same GO-class show correlated expression levels.

Conclusion: This finding is concurrent with the naive hypothesis that the scales of production of interacting proteins are linked because an efficient interaction demands that involved proteins are available to some degree. The goal of further research in this field will be to understand the biological mechanisms behind this observation.


Figures

Figure 1
Figure 1
Empirical and background distribution of correlation values. For each interaction pair and for each dataset we calculated the correlation of expression levels of genes encoding interacting protein pairs. The graph shows slightly higher correlation values in the datasets (empirical distribution) than the correlation in the case of random protein pairs (background distribution).
Figure 2
Figure 2
Distribution of mutual information. For each interaction pair and for each dataset we calculated the mutual information of expression levels of genes encoding interacting protein pairs. The graph shows empirical and background distribution to be very similar.
Figure 3
Figure 3
Correlations and p-values of the expression dataset from Chi. The diagram contains the contains the box-and-whisker plots and the p-values of the twenty GO-classes that yield the most significant results for the respective dataset and of the GO-class biological process. It shows for different GO-classes, how strongly the expression levels of genes that encode interacting proteins from this common GO-class are correlated. The GO-classes along the x-axis are ordered by the corresponding p-value. This p-value gives the probability to get the depicted correlation results using random interacting protein pairs from the respective GO-class. For comparison the GO-class 'biological process', which comprises all interaction pairs (except the self-interactions), has been added.
Figure 4
Figure 4
Correlations and p-values of the expression dataset from Higgins. Analogous to figure 3
Figure 5
Figure 5
Correlations and p-values of the expression dataset from Pathan. Analogous to figure 3
Figure 6
Figure 6
Correlations and p-values of the expression dataset from Zhang. Analogous to figure 3
Figure 7
Figure 7
Correlations and p-values of the expression dataset from Zhao. Analogous to figure 3

References

    1. Brown PO, Botstein D. Exploring the new world of the genome with DNA microarrays. Nat Genet. 1999;21:33–7. doi: 10.1038/4462. - DOI - PubMed
    1. Lockhart DJ, Winzeler EA. Genomics, gene expression and DNA arrays. Nature. 2000;405:827–36. doi: 10.1038/35015701. - DOI - PubMed
    1. Young RA. Biomedical discovery with DNA arrays. Cell. 2000;102:9–15. doi: 10.1016/S0092-8674(00)00005-2. - DOI - PubMed
    1. Cho S, Park SG, Lee do H, Park BC. Protein-protein interaction networks: from interactions to networks. J Biochem Mol Biol. 2004;37:45–52. - PubMed
    1. Ge H, Liu Z, Church GM, Vidal M. Correlation between transcriptome and interactome mapping data from Saccharomyces cerevisiae. Nat Genet. 2001;29:482–6. doi: 10.1038/ng776. - DOI - PubMed

LinkOut - more resources