

An analysis of the use of genomic DNA as a universal reference in two channel DNA microarrays
- PMID: 15877823
- PMCID: PMC1142311
- DOI: 10.1186/1471-2164-6-66
An analysis of the use of genomic DNA as a universal reference in two channel DNA microarrays
Abstract
Background: DNA microarray is an invaluable tool for gene expression explorations. In the two-dye microarray, fluorescence intensities of two samples, each labeled with a different dye, are compared after hybridization. To compare a large number of samples, the 'reference design' is widely used, in which all RNA samples are hybridized to a common reference. Genomic DNA is an attractive candidate for use as a universal reference, especially for bacterial systems with a low percentage of non-coding sequences. However, genomic DNA, comprising of both the sense and anti-sense strands, is unlike the single stranded cDNA usually used in microarray hybridizations. The presence of the antisense strand in the 'reference' leads to reactions between complementary labeled strands in solution and may cause the assay result to deviate from true values.
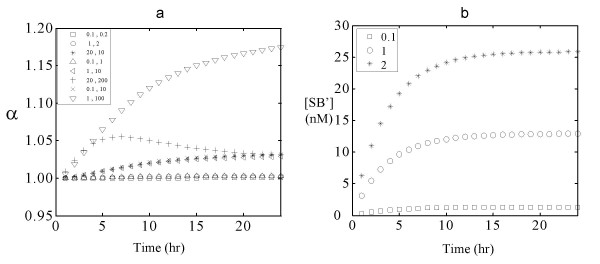
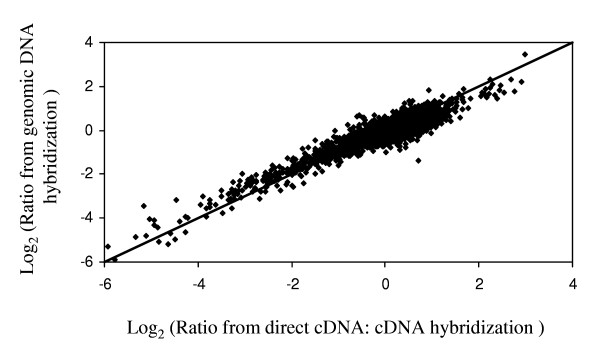
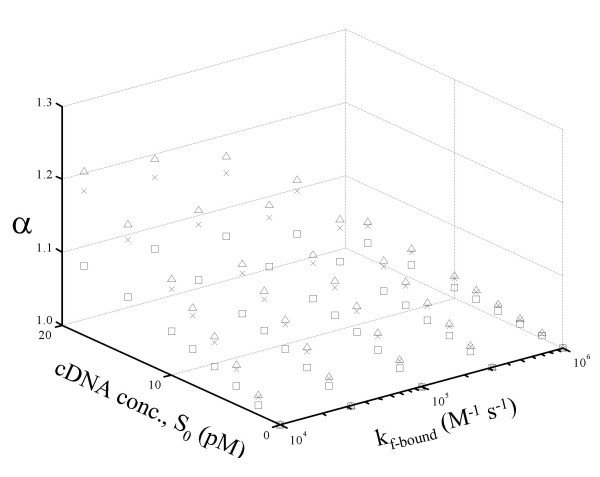
Results: We have developed a mathematical model to predict the validity of using genomic DNA as a reference in the microarray assay. The model predicts that the assay can accurately estimate relative concentrations for a wide range of initial cDNA concentrations. Experimental results of DNA microarray assay using genomic DNA as a reference correlated well to those obtained by a direct hybridization between two cDNA samples. The model predicts that the initial concentrations of labeled genomic DNA strands and immobilized strands, and the hybridization time do not significantly affect the assay performance. At low values of the rate constant for hybridization between immobilized and mobile strands, the assay performance varies with the hybridization time and initial cDNA concentrations. For the case where a microarray with immobilized single strands is used, results from hybridizations using genomic DNA as a reference will correspond to true ratios under all conditions.
Conclusion: Simulation using the mathematical model, and the experimental study presented here show the potential utility of microarray assays using genomic DNA as a reference. We conclude that the use of genomic DNA as reference DNA should greatly facilitate comparative transcriptome analysis.
Figures

Similar articles
-
A diffusion-reaction model for DNA microarray assays.J Biotechnol. 2004 Oct 19;114(1-2):31-45. doi: 10.1016/j.jbiotec.2004.05.008. J Biotechnol. 2004. PMID: 15464596
-
Strand-specific transcriptome profiling with directly labeled RNA on genomic tiling microarrays.BMC Mol Biol. 2011 Jan 14;12:3. doi: 10.1186/1471-2199-12-3. BMC Mol Biol. 2011. PMID: 21235785 Free PMC article.
-
Use of genomic DNA as reference in DNA microarrays.Methods Mol Biol. 2009;544:439-50. doi: 10.1007/978-1-59745-483-4_29. Methods Mol Biol. 2009. PMID: 19488717
-
Genomic profiling: cDNA arrays and oligoarrays.Methods Mol Biol. 2012;823:89-105. doi: 10.1007/978-1-60327-216-2_7. Methods Mol Biol. 2012. PMID: 22081341 Review.
-
Improving reliability and performance of DNA microarrays.Expert Rev Mol Diagn. 2006 May;6(3):481-92. doi: 10.1586/14737159.6.3.481. Expert Rev Mol Diagn. 2006. PMID: 16706748 Review.
Cited by
-
Modulation of Multiple Gene Clusters' Expression by the PAS-LuxR Transcriptional Regulator PteF.Antibiotics (Basel). 2022 Jul 24;11(8):994. doi: 10.3390/antibiotics11080994. Antibiotics (Basel). 2022. PMID: 35892384 Free PMC article.
-
Toward genomic cell culture engineering.Cytotechnology. 2006 Mar;50(1-3):121-40. doi: 10.1007/s10616-006-9004-9. Epub 2006 Jul 25. Cytotechnology. 2006. PMID: 19003075 Free PMC article.
-
BABAR: an R package to simplify the normalisation of common reference design microarray-based transcriptomic datasets.BMC Bioinformatics. 2010 Feb 3;11:73. doi: 10.1186/1471-2105-11-73. BMC Bioinformatics. 2010. PMID: 20128918 Free PMC article.
-
Assessment of data processing to improve reliability of microarray experiments using genomic DNA reference.BMC Genomics. 2008 Sep 16;9 Suppl 2(Suppl 2):S5. doi: 10.1186/1471-2164-9-S2-S5. BMC Genomics. 2008. PMID: 18831796 Free PMC article.
-
Os odontoideum in identical twins: Comparative gene expression analysis.Surg Neurol Int. 2014 Mar 20;5:37. doi: 10.4103/2152-7806.129259. eCollection 2014. Surg Neurol Int. 2014. PMID: 24818044 Free PMC article.
References
Publication types
MeSH terms
Substances
Grants and funding
LinkOut - more resources
Full Text Sources
