. 2005 May 15;174(10):5987-93.
doi: 10.4049/jimmunol.174.10.5987.

TGF-beta 1 inhibits mast cell Fc epsilon RI expression

Affiliations

TGF-beta 1 inhibits mast cell Fc epsilon RI expression

Gregorio Gomez et al. J Immunol. .

Abstract

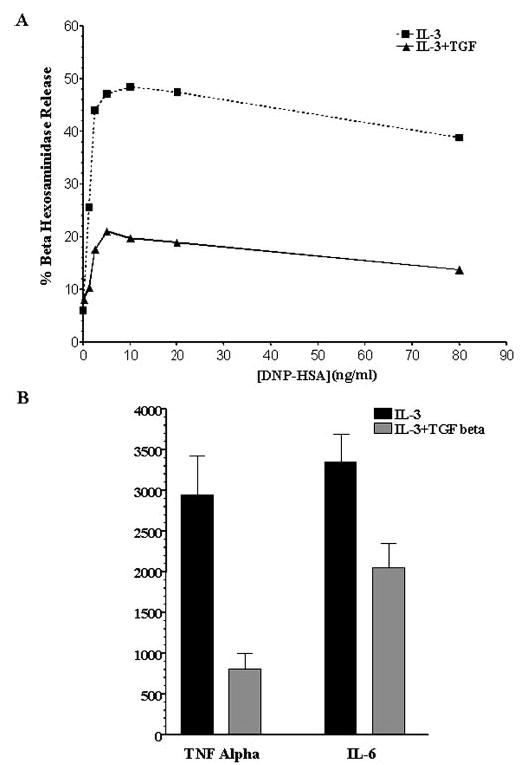
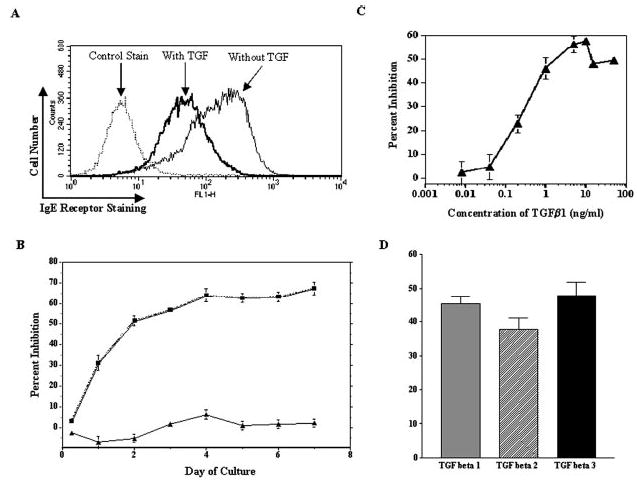
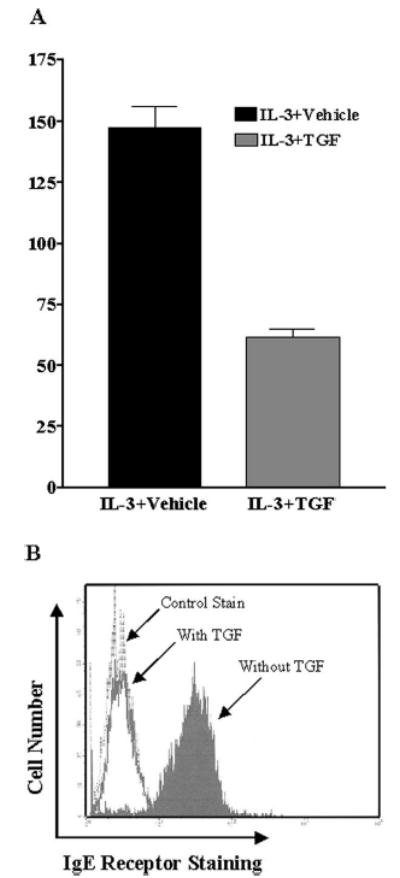
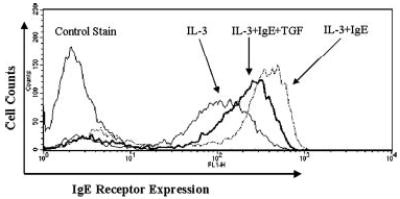
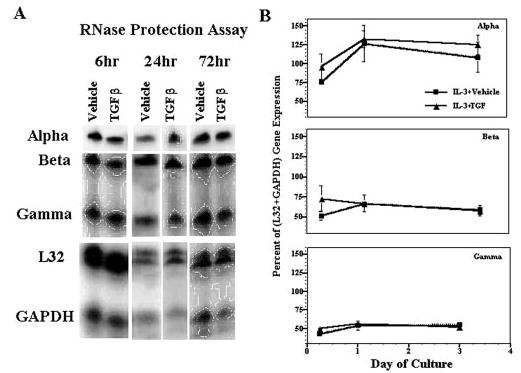
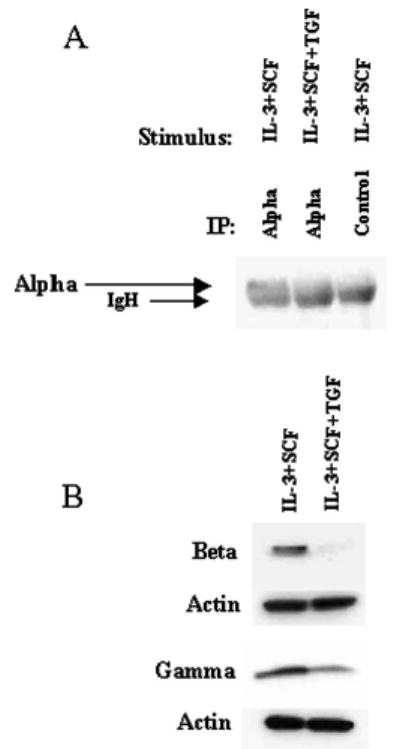
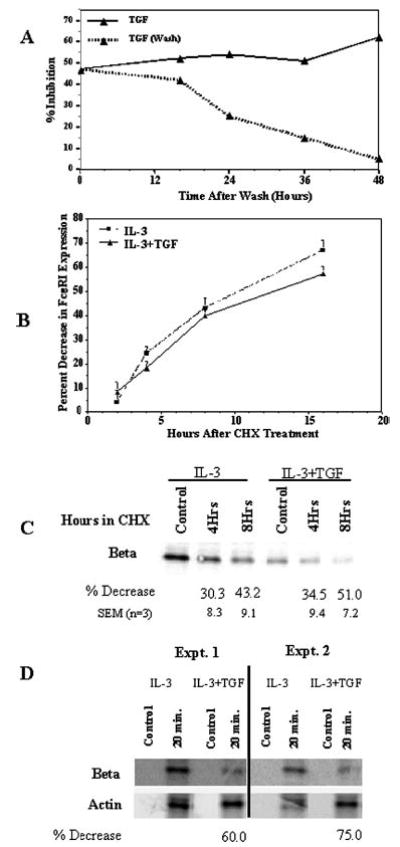
Mast cell activation through the high affinity IgE receptor (FcepsilonRI) is a critical component of atopic inflammation. The cytokine TGF-beta1 has been shown to inhibit IgE-dependent mast cell activation, possibly serving to dampen mast cell-mediated inflammatory responses. We present proof that TGF-beta1 inhibits mast cell FcepsilonRI expression through a reversible pathway that diminishes protein, but not mRNA, expression of the FcepsilonRI subunit proteins alpha, beta, and gamma. The stability of the expressed proteins and the assembled cell surface complex was unaltered by TGF-beta1 treatment. However, TGF-beta1 decreased the rate of FcepsilonRI beta-chain synthesis, arguing that this inhibitory cytokine exerts its effects at the level of mRNA translation. TGF-beta1 consistently diminished FcepsilonRI expression on cultured human or mouse mast cells as well as freshly isolated peritoneal mast cells. The related cytokines, TGF-beta2 and TGF-beta3, had similar effects. We propose that TGF-beta1 acts as a negative regulator of mast cell function, in part by decreasing FcepsilonRI expression.


Figures

FIGURE 1
FIGURE 1
TGF-β1 inhibits IgE-mediated mast cell degranulation and the production of TNF-α and IL-6. BMMC were cultured with or without TGF-β1 (5 ng/ml) for 3 days. Cells were then stimulated with IgE and DNP-HSA. A, BMMC received the indicated concentration of DNP-HSA for 60 min. β-Hexosaminidase release was measured by enzymatic assay as described in Materials and Methods. Data shown are the means of two samples from one of two independent experiments that produced similar results. B, BMMC were stimulated with 50 ng/ml DNP-HSA for 9 h. Culture supernatants were harvested, and cytokine concentrations were determined by ELISA. Data shown are the mean and SE of seven samples from one of four independent experiments that gave similar results.
FIGURE 2
FIGURE 2
TGF-β1 inhibits mouse mast cell FcεRI expression. A, BMMC were cultured for 3 days in IL-3 and SCF with or without TGF-β1, after which FcεRI surface expression was assessed by flow cytometry. Control staining was with FITC-anti-IgE staining in the absence of IgE. Data shown are a representative histogram from one of 42 experiments using 15 BMMC populations. B, Time course of TGF-β1-mediated inhibition. BMMC were cultured as described in A for the indicated times, after which surface FcεRI expression was assessed by flow cytometry. Percent inhibition was determined by comparing the mean fluorescence intensities of cells cultured in IL-3 with and without TGF-β1. Data shown are the mean and SE of 6–18 samples/point. C, Concentration-dependent effects of TGF-β1 on mouse FcεRI expression. BMMC were cultured as described in A for 3 days. Percent inhibition of FcεRI expression was determined by comparing surface staining of cells cultured in IL-3 with that of cells cultured in IL-3 and TGF-β1. Data shown are the mean and SE from six samples. D, BMMC were cultured for 3 days in IL-3 with or without TGF-β1, TGF-β2, or TGF-β3 (5 ng/ml each). The percent inhibition of surface FcεRI expression was determined as described in B, using six BMMC populations. When comparing the percent inhibition induced by each stimulus, p > 0.05.
FIGURE 3
FIGURE 3
TGF-β1 inhibits FcεRI surface expression on mouse peritoneal mast cells and cultured human mast cells. A, Mouse peritoneal lavage cells were cultured in IL-3 and SCF with or without TGF-β1 for 3 days. Data shown are the average and SD of four separate populations, showing the mean fluorescence intensity of FcεRI staining on Kit-positive cells (mast cells) in the presence or the absence of TGF-β1. B, Human mast cells were cultured in SCF with or without TGF-β1 (15 ng/ml) for 3 days. FcεRI surface expression was determined by flow cytometry using anti-FcεRIα or a control Ab. Results are representative of two different mast cell cultures.
FIGURE 4
FIGURE 4
TGF-β1 inhibits IgE-mediated up-regulation of FcεRI surface expression. BMMC were cultured for 4 days in the presence or the absence of IgE (1 μg/ml). On day 4 of culture, cells were fed, and TGF-β1 (5 ng/ml) was added to one set of samples containing IgE for 3 days. Surface FcεRI expression was assessed by flow cytometry. Data shown are one representative histogram from seven BMMC populations that gave similar responses.
FIGURE 5
FIGURE 5
TGF-β1 does not affect FcεRI mRNA expression. A, BMMC were cultured in IL-3 plus vehicle or TGF-β1 (5 ng/ml) for the indicated times. Down-regulation of surface FcεRI expression was confirmed by flow cytometry on day 3 of culture (not shown). The expression of FcεRI subunits and control mRNAs was determined by RPA using total RNA. B, RPA results were quantified by phosphorimaging, using L32 and GAPDH housekeeping gene expression as loading controls. The expression of each FcεRI subunit mRNA relative to the sum of housekeeping gene expression in each lane is shown. Data are the mean and SE of four separate samples.
FIGURE 6
FIGURE 6
TGF-β1 inhibits the expression of FcεRI subunit proteins. BMMC were cultured in IL-3 and SCF with or without TGF-β1 for 3 days, and down-regulation of surface FcεRI expression was confirmed by flow cytometry. A, Total protein from 30 million cells was immunoprecipitated with anti-FcεRIα or control IgG. Immunoprecipitates were subjected to SDS-PAGE and Western blotting with anti-FcεRI. Data shown are representative of two independent experiments. B, Total protein from ~1 million cells was subjected to SDS-PAGE and Western blotting with anti-FcεRIβ or -γ. The same membranes were stripped and reprobed with anti-actin to demonstrate protein loading. Data shown are representative of three to five independent experiments.
FIGURE 7
FIGURE 7
The inhibitory effects of TGF-β1 on surface FcεRI expression are reversible and do not enhance the rate of FcεRI degradation. A, BMMC were cultured for 3 days with or without TGF-β1. Half the TGF-β1-stimulated cells were washed and replated in medium without TGF-β1 on day 3. Over the following 48 h, samples were assessed for surface FcεRI expression by flow cytometry. Percent inhibition of surface FcεRI expression was determined using cultures never receiving TGF-β1, as described in Fig. 1. Data are the mean and SE (too small to be visualized) of eight BMMC populations. B, BMMC were cultured for 3 days in IL-3 and SCF with or without TGF-β1. On day 3, cycloheximide (CHX) or DMSO was added to the cultures for 2–16 h. Using DMSO-treated cells as a control, the CHX-mediated decrease in surface FcεRI expression on cells cultured with or without TGF-β1 was assessed by flow cytometry. Data shown are the mean and SE of 12 samples. C, Cells were cultured and treated with CHX or DMSO as described in B. Total cell lysates from 1 million cells were subjected to SDS-PAGE and Western blotting to detect FcεRI β-chain expression. The percent decrease in expression obtained from three experiments is shown below the respective bands. D, BMMC were cultured in IL-3 with or without TGF-β1 for 3 days. Cells were starved of cysteine and methionine (control), then incubated with 35S-labeled cysteine and methionine for 20 min. FcεRI β-chain and actin were sequentially immunoprecipitated and resolved by gel electrophoresis as described in Materials and Methods.

References

    1. Massague J. The transforming growth factor-β family. Annu Rev Cell Biol. 1990;6:597–641. - PubMed
    1. Shi Y, Massague J. Mechanisms of TGF-β signaling from cell membrane to the nucleus. Cell. 2003;113:685–700. - PubMed
    1. ten Dijke P, Hill CS. New insights into TGF-β SMAD signaling. Trends Biochem Sci. 2004;29:265–273. - PubMed
    1. Blobe GC, Schiemann WP, Lodish HF. Role of transforming growth factor β in human disease. N Engl J Med. 2000;342:1350–1358. - PubMed
    1. Letterio JJ, Roberts AB. Regulation of immune responses by TGF-β. Annu Rev Immunol. 1998;16:137–161. - PubMed

Publication types

MeSH terms