Comparative Study
. 2005 May 15;174(10):5994-6004.
doi: 10.4049/jimmunol.174.10.5994.

Multiple costimulatory modalities enhance CTL avidity

Affiliations
Comparative Study

Multiple costimulatory modalities enhance CTL avidity

James W Hodge et al. J Immunol. .

Erratum in

  • J Immunol. 2005 Jun 15;174(12):8220

Abstract

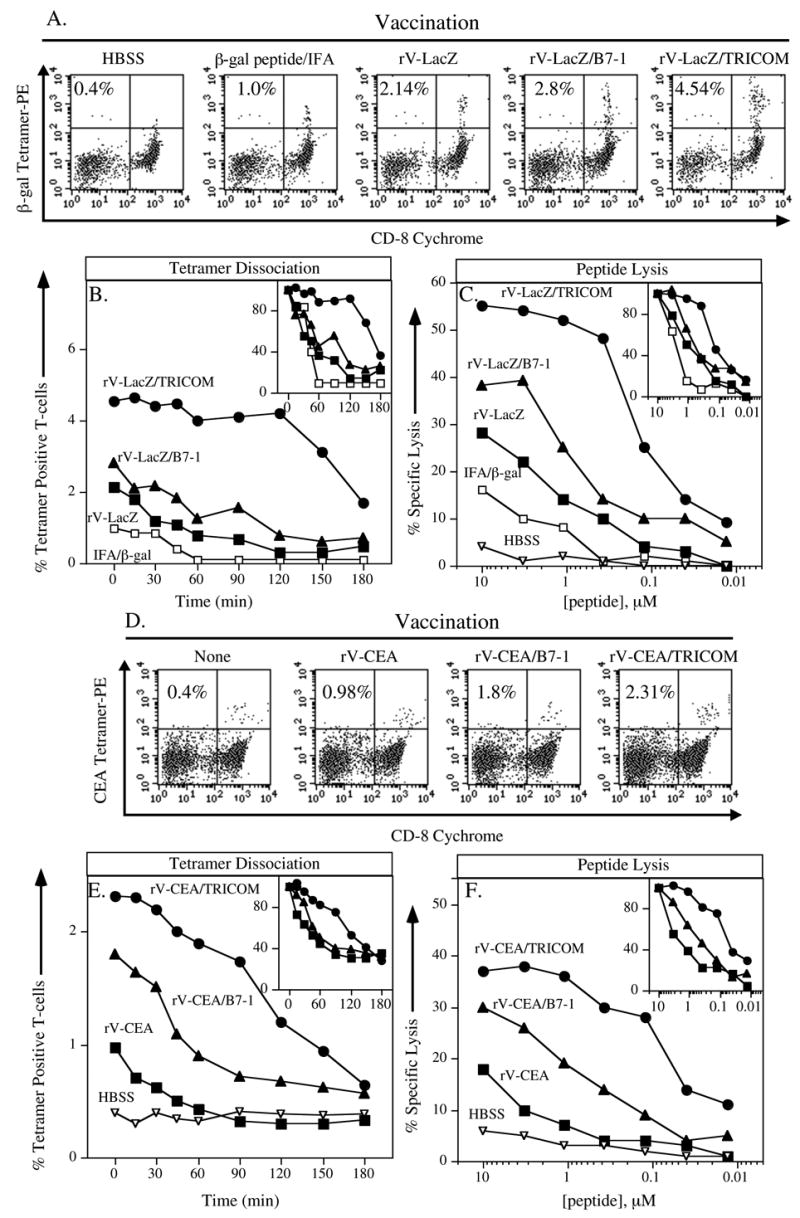
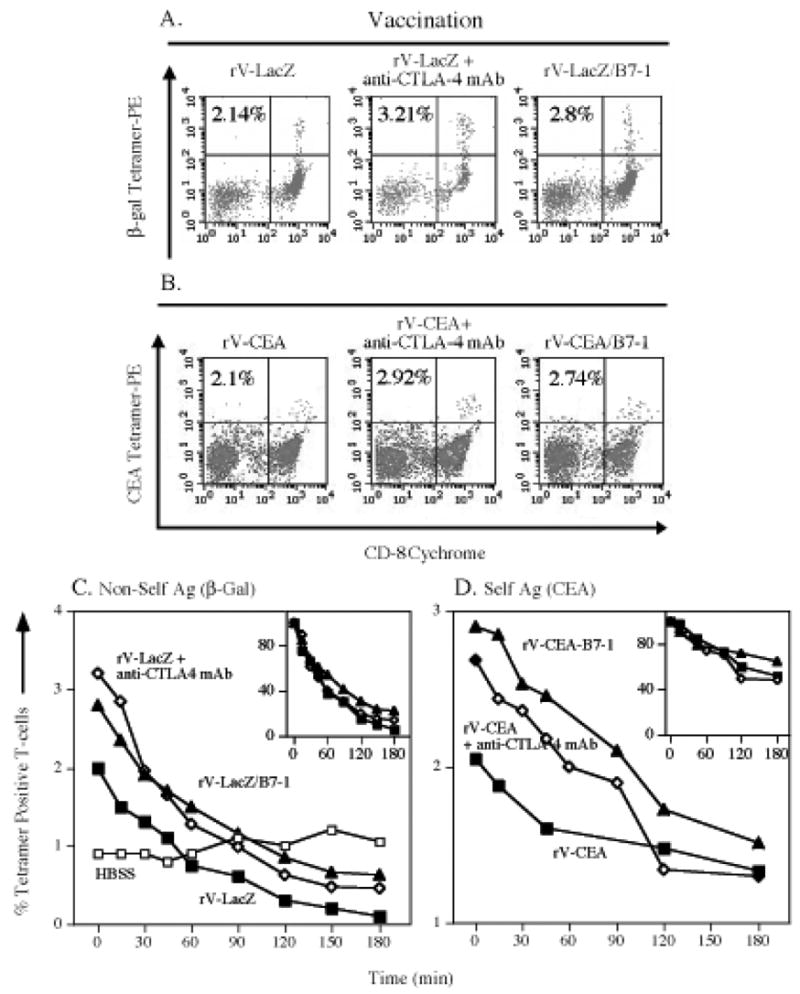
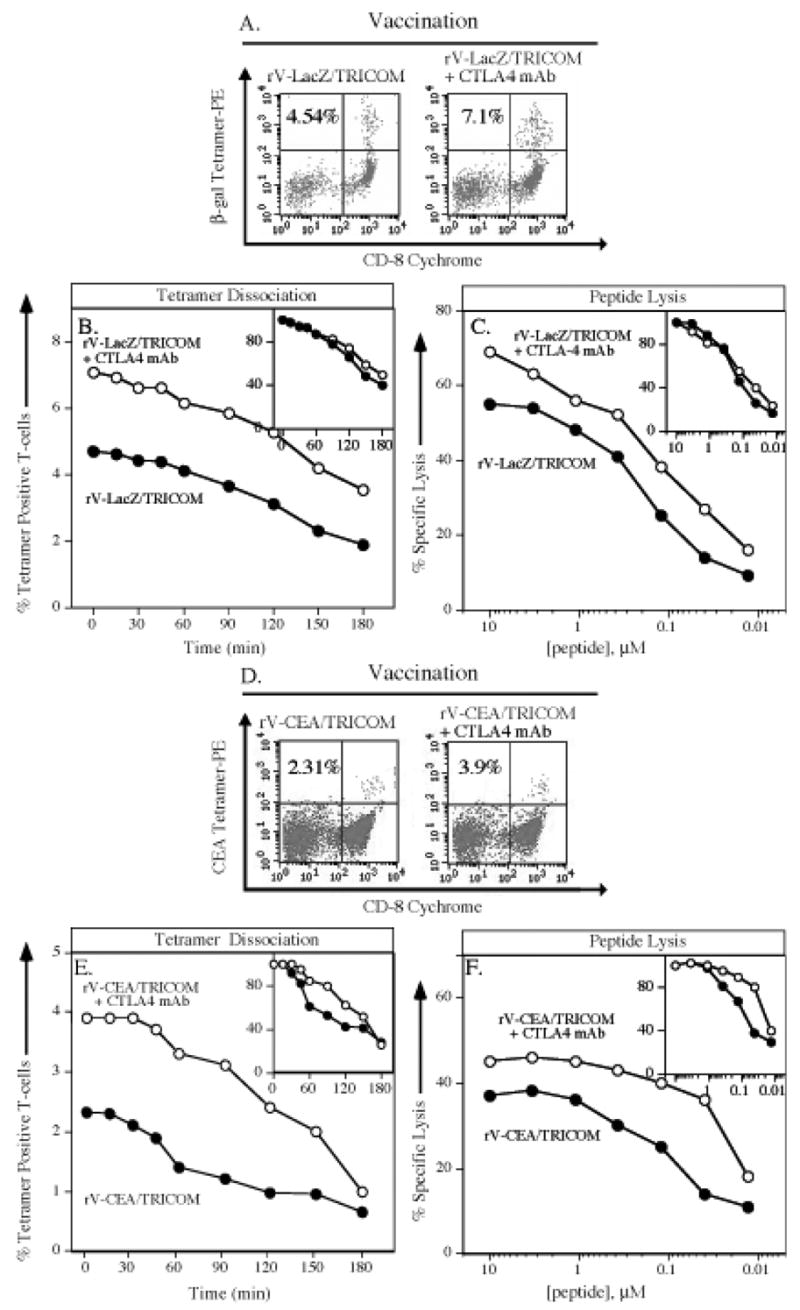
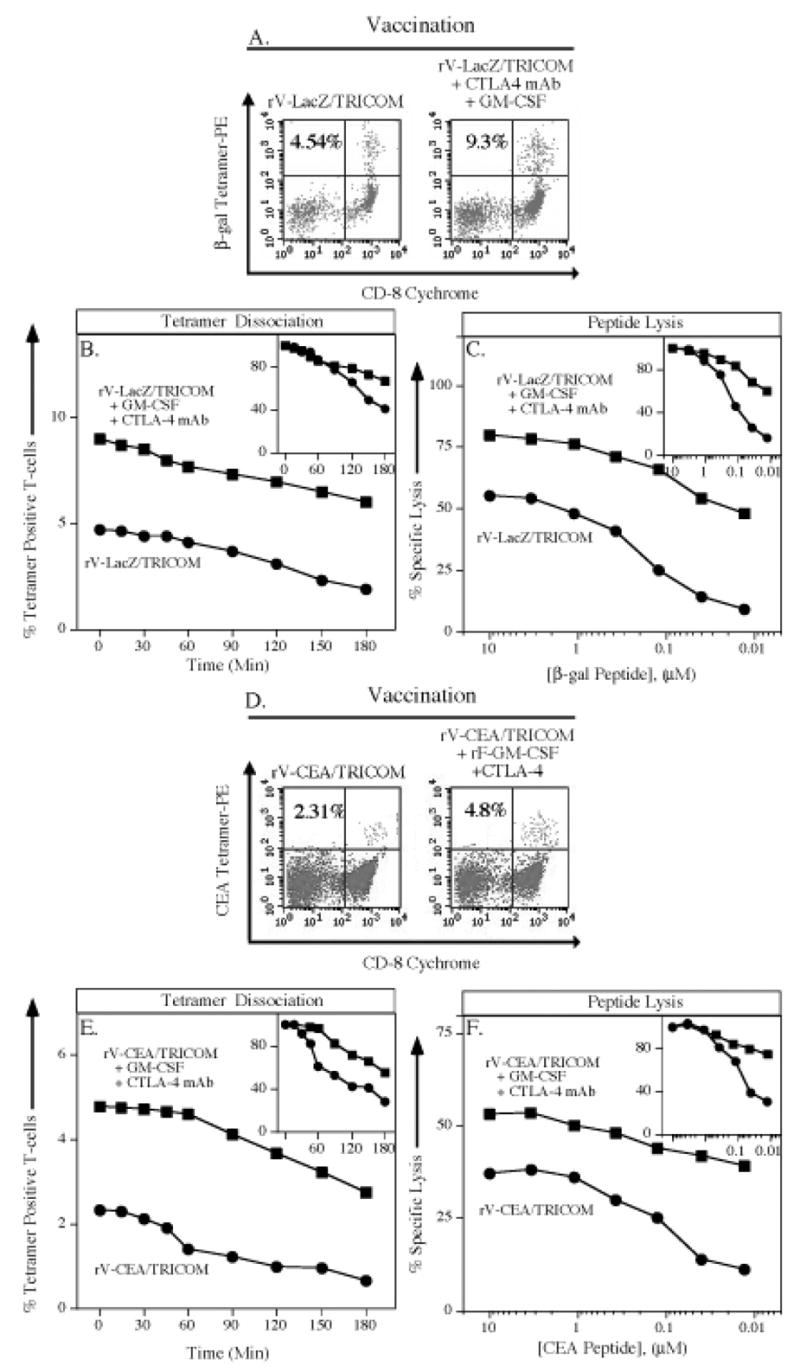
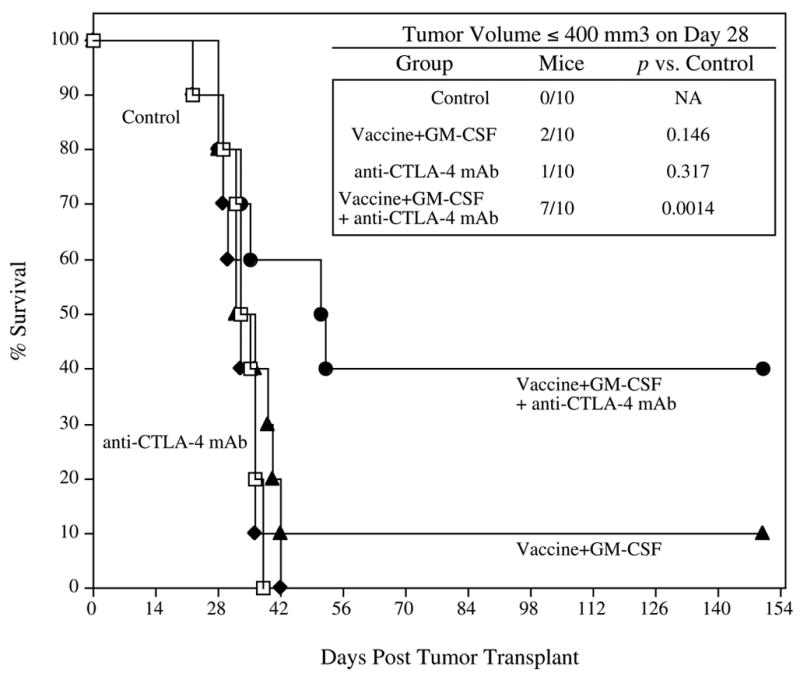
Recent studies in both animal models and clinical trials have demonstrated that the avidity of T cells is a major determinant of antitumor and antiviral immunity. In this study, we evaluated several different vaccine strategies for their ability to enhance both the quantity and avidity of CTL responses. CD8(+) T cell quantity was measured by tetramer binding precursor frequency, and avidity was measured by both tetramer dissociation and quantitative cytolytic function. We have evaluated a peptide, a viral vector expressing the Ag transgene alone, with one costimulatory molecule (B7-1), and with three costimulatory molecules (B7-1, ICAM-1, and LFA-3), with anti-CTLA-4 mAb, with GM-CSF, and combinations of the above. We have evaluated these strategies in both a foreign Ag model using beta-galactosidase as immunogen, and in a "self" Ag model, using carcinoembryonic Ag as immunogen in carcinoembryonic Ag transgenic mice. The combined use of several of these strategies was shown to enhance not only the quantity, but, to a greater magnitude, the avidity of T cells generated; a combination strategy is also shown to enhance antitumor effects. The results reported in this study thus demonstrate multiple strategies that can be used in both antitumor and antiviral vaccine settings to generate higher avidity host T cell responses.


Figures

Figure 1
Figure 1. Relationship of vaccine-mediated costimulation to antigen-specific T-cell precursor frequency and T-cell avidity
Panels A–C: C57BL/6 mice were vaccinated with buffer (HBSS, inverted open triangles), β-gal peptide emulsified in Incomplete Freunds adjuvant (IFA, open squares), rV-LacZ (closed squares), rV-LacZ/B7-1 (closed triangles), or rV-LacZ/TRICOM (closed circles). After 30 days, splenocytes were harvested. Panel A: β-gal–specific CD8+ T-cell precursor frequency as determined by tetramer staining. Inset number indicates percent β-gal tetramer+/CD8+ T cells of CD3+ T cells. Panel B: β-gal–specific CD8+ T-cell avidity as determined by tetramer dissociation. To normalize groups within each experiment, data was also expressed as the percentage of maximum tetramer binding over time (Inset panel). Panel C: β-gal–specific CD8+ T-cell avidity as determined by CTL assay. Inset panel depicts results that are normalized as the percentage of maximum lysis.(11) Panels D–F: CEA-Tg mice were vaccinated with either buffer (HBSS, inverted open triangles), rV-CEA (closed squares), rV-CEA/B7-1 (closed triangles), or rV-CEA/TRICOM (closed circles). After 30 days, splenocytes were harvested. Panel D: CEA-specific CD8+ T-cell precursor frequency as determined by tetramer staining. Inset number indicates percent CEA tetramer+/CD8+ T cells of CD3+ T cells. Panel E: CEA-specific CD8+ T-cell avidity as determined by tetramer dissociation. Inset panel depicts results that are normalized as the percentage of maximum tetramer binding. Panel F: CEA-specific CD8+ T-cell avidity as determined by CTL assay. Inset panel depicts results that are normalized as the percentage of maximum lysis.
Figure 2
Figure 2. Effect of in-vitro stimulation on T-cell precursors and avidity
C57BL/6 mice were vaccinated with rV-LacZ (open squares) or rV-LacZ/TRICOM (closed circles). After 30 days, splenocytes were harvested (n=3/group). β-gal–specific CD8+ T-cell avidity was determined by tetramer dissociation from T cells isolated directly from splenocytes (Panels A and C) or after a 7-day in-vitro stimulation with β-gal peptide (Panels B and D). To normalize groups within each experiment, data was also expressed as the percentage of maximum tetramer binding (Panels C and D).
Figure 3
Figure 3. Evaluation of positive vs. negative costimulation strategies on antigen-specific T-cell precursor frequency and T-cell avidity
Panels A and C: C57BL/6 mice were vaccinated with rV-LacZ (closed squares), rV-LacZ in combination with anti-CTLA-4 mAb (open diamonds) or rV-LacZ/B7-1 (closed triangles). Panels B and D: CEA-Tg mice were vaccinated with rV-CEA (closed squares), rV-CEA in combination with anti-CTLA-4 mAb (open diamonds) or rV-CEA/B7-1 (closed triangles). After 30 days, splenocytes were harvested. Panel A: β-gal–specific CD8+ T-cell precursor frequency as determined by tetramer staining. Inset number indicates percent β-gal tetramer+/CD8+ T- cells of CD3+ T-cells. Panel B: CEA-specific CD8+ T-cell precursor frequency as determined by tetramer staining. Inset number indicates percent CEA-tetramer+/CD8+ T cells of CD3+ T cells. Panel C: β-gal–specific CD8+ T-cell avidity as determined by tetramer dissociation. Panel D: CEA-specific CD8+ T-cell avidity as determined by tetramer dissociation. Inset panels depict results that are normalized as the percentage of maximum tetramer binding.
Figure 4
Figure 4. Contribution of anti-CTLA-4 mAb to TRICOM costimulation on antigen-specific T-cell precursor frequency and T-cell avidity
Panels A–C: C57BL/6 mice were vaccinated with rV-LacZ/TRICOM (closed circles) or rV-LacZ/TRICOM in combination with anti-CTLA-4 mAb (open circles). After 30 days, splenocytes were harvested. Panel A: β-gal specific CD8+ T-cell precursor frequency as determined by tetramer staining. Inset number indicates percent β-gal tetramer+/CD8+ T cells of CD3+ T cells. Panel B: β-gal–specific CD8+ T-cell avidity as determined by tetramer dissociation. Inset panel depicts results that are normalized as the percentage of maximum tetramer binding. Panel C: β-gal–specific CD8+ T-cell avidity as determined by CTL assay. Inset panel depicts results that are normalized as the percentage of maximum lysis. Panels D–F: CEA-Tg mice were vaccinated with rV-CEA/TRICOM (closed circles) or rV-CEA/TRICOM in combination with anti-CTLA-4 mAb (open circles). After 30 days, splenocytes were harvested. Panel D: CEA-specific CD8+ T-cell precursor frequency as determined by tetramer staining. Inset number indicates percent CEA tetramer+/CD8+ T cells of CD3+ T cells. Panel E: CEA-specific CD8+ T-cell avidity as determined by tetramer dissociation. Inset panel depicts results that are normalized as the percentage of maximum tetramer binding. Panel F: CEA-specific CD8+ T-cell avidity as determined by CTL assay. Inset panel depicts results that are normalized as the percentage of maximum lysis.
Figure 5
Figure 5. Contribution of GM-CSF to TRICOM-mediated costimulation on antigen-specific T-cell precursor frequency and T-cell avidity
Panels A–C: C57BL/6 mice were vaccinated with rV-LacZ/TRICOM (closed circles) or rV-LacZ/TRICOM in combination with rF-GM-CSF (open triangles). After 30 days, splenocytes were harvested. Panel A: β-gal–specific CD8+ T-cell precursor frequency as determined by tetramer staining. Inset number indicates percent β-gal tetramer+/CD8+ T cells of CD3+ T cells. Panel B: β-gal–specific CD8+ T-cell avidity as determined by tetramer dissociation. Inset panel depicts results that are normalized as the percentage of maximum tetramer binding. Panel C: β-gal–specific CD8+ T-cell avidity as determined by CTL assay. Inset panel depicts results that are normalized as the percentage of maximum lysis. Panels D–F: CEA-Tg mice were vaccinated with rV-CEA/TRICOM (closed circles) or rV-CEA/TRICOM in combination with rF-GM-CSF (open triangles). After 30 days, splenocytes were harvested. Panel D: CEA-specific CD8+ T-cell precursor frequency as determined by tetramer staining. Inset number indicates percent CEA tetramer+/CD8+ T cells of CD3+ T cells. Panel E: CEA-specific CD8+ T-cell avidity as determined by tetramer dissociation. Inset panel depicts results that are normalized as the percentage of maximum tetramer binding. Panel F: CEA-specific CD8+ T-cell avidity as determined by CTL assay. Inset panel depicts results that are normalized as the percentage of maximum lysis.
Figure 6
Figure 6. Effects of combined use of anti-CTLA-4 mAb, GM-CSF, and TRICOM-mediated costimulation on antigen-specific T-cell precursor frequency and T-cell avidity
Panels A–C: C57BL/6 mice were vaccinated with rV-LacZ/TRICOM (closed circles) or rV-LacZ/TRICOM in combination with rF-GM-CSF and anti-CTLA-4 mAb (closed squares). After 30 days, splenocytes were harvested. Panel A: β-gal–specific CD8+ T-cell precursor frequency as determined by tetramer staining. Inset number indicates percent β-gal tetramer+/CD8+ T cells of CD3+ T cells. Panel B: β-gal–specific CD8+ T-cell avidity as determined by tetramer dissociation. Inset panel depicts results that are normalized as the percentage of maximum tetramer binding. Panel C: β-gal–specific CD8+ T-cell avidity as determined by CTL assay. Inset panel depicts results that are normalized as the percentage of maximum lysis. Panels D–F: CEA-Tg mice were vaccinated with rV-CEA/TRICOM (closed circles) or rV-CEA/TRICOM in combination with rF-GM-CSF and anti-CTLA-4 mAb (closed squares). After 30 days, splenocytes were harvested. Panel D: CEA-specific CD8+ T-cell precursor frequency as determined by tetramer staining. Inset number indicates percent CEA tetramer+/CD8+ T cells of CD3+ T cells. Panel E: CEA-specific CD8+ T-cell avidity as determined by tetramer dissociation. Inset panel depicts results that are normalized as the percentage of maximum tetramer binding. Panel F: CEA-specific CD8+ T-cell avidity as determined by CTL assay. Inset panel depicts results that are normalized as the percentage of maximum lysis.
Figure 7
Figure 7. Tumor therapy with CEA/TRICOM vaccine, GM-CSF and anti-CTLA-4 mAb
CEA-Tg mice (n=10/group) were transplanted s.c. with MC38-CEA+ tumors on day 0. Four days later, mice received rV-CEA/TRICOM prime vaccination admixed with rF-GM-CSF and were administered anti-CTLA-4 mAb, followed by three weekly boosts with rF-CEA/TRICOM admixed with rF-GM-CSF (closed circles). Another group of CEA-Tg mice received rV-CEA/TRICOM prime vaccination admixed with rF-GM-CSF followed by three weekly boosts with rF-CEA/TRICOM admixed with rF-GM-CSF (closed triangles). Another group of mice received anti-CTLA-4 mAb alone (closed diamonds). A control group received buffer (HBSS, open squares). Mice in each group were monitored weekly for tumor size and survival. Inset panel: Tumor volumes ≤ 400 mm3.

References

    1. Alexander-Miller MA, Leggatt GR, Berzofsky JA. Selective expansion of high- or low-avidity cytotoxic T lymphocytes and efficacy for adoptive immunotherapy. Proc Natl Acad Sci U S A. 1996;93:4102. - PMC - PubMed
    1. Berzofsky JA, Ahlers JD, Derby MA, Pendleton CD, Arichi T, Belyakov IM. Approaches to improve engineered vaccines for human immunodeficiency virus and other viruses that cause chronic infections. Immunol Rev. 1999;170:151. - PubMed
    1. Berzofsky JA, Ahlers JD, Belyakov IM. Strategies for designing and optimizing new generation vaccines. Nat Rev Immunol. 2001;1:209. - PubMed
    1. Snyder JT, Alexander-Miller M, Berzofsky J, Belyakov IM. Molecular mechanisms and biological significance of CTL avidity. Current HIV Research. 2003;1:287. - PubMed
    1. Derby M, Alexander-Miller M, Tse R, Berzofsky J. High-avidity CTL exploit two complementary mechanisms to provide better protection against viral infection than low-avidity CTL. J Immunol. 2001;166:1690. - PubMed

Publication types

MeSH terms