Main phase transitions in supported lipid single-bilayer
- PMID: 15879467
- PMCID: PMC1366594
- DOI: 10.1529/biophysj.105.062463
Main phase transitions in supported lipid single-bilayer
Abstract
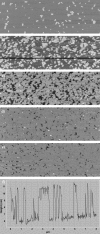
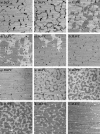
We have studied the phase transitions of a phospholipidic single-bilayer supported on a mica substrate by real-time temperature-controlled atomic force microscopy. We show the existence of two phase transitions in this bilayer that we attribute to two gel (L(beta))/fluid (L(alpha)) transitions, corresponding to the independent melting of each leaflet of the bilayer. The ratio of each phase with temperature and the large broadening of the transitions' widths have been interpreted through a basic thermodynamic framework in which the surface tension varies during the transitions. The experimental data can be fit with such a model using known thermodynamic parameters.
Figures


Similar articles
-
Gel-to-fluid phase transformations in solid-supported phospholipid bilayers assembled by the Langmuir-Blodgett technique: effect of the Langmuir monolayer phase state and molecular density.J Phys Chem B. 2014 Aug 14;118(32):9708-21. doi: 10.1021/jp504092b. Epub 2014 Aug 4. J Phys Chem B. 2014. PMID: 25059993
-
Atomic force microscopy study of thick lamellar stacks of phospholipid bilayers.Phys Rev E Stat Nonlin Soft Matter Phys. 2008 Feb;77(2 Pt 1):021905. doi: 10.1103/PhysRevE.77.021905. Epub 2008 Feb 7. Phys Rev E Stat Nonlin Soft Matter Phys. 2008. PMID: 18352049
-
Simulation studies of protein-induced bilayer deformations, and lipid-induced protein tilting, on a mesoscopic model for lipid bilayers with embedded proteins.Biophys J. 2005 Mar;88(3):1778-98. doi: 10.1529/biophysj.104.050849. Biophys J. 2005. PMID: 15738466 Free PMC article.
-
Optical dynamometry to study phase transitions in lipid membranes.Methods Mol Biol. 2007;400:227-36. doi: 10.1007/978-1-59745-519-0_15. Methods Mol Biol. 2007. PMID: 17951737 Review.
-
Phase transitions in supported lipid bilayers studied by AFM.Soft Matter. 2014 Oct 7;10(37):7145-64. doi: 10.1039/c4sm01104j. Soft Matter. 2014. PMID: 25090108 Review.
Cited by
-
Reversible Dissolution of Microdomains in Detergent-Resistant Membranes at Physiological Temperature.PLoS One. 2015 Jul 6;10(7):e0132696. doi: 10.1371/journal.pone.0132696. eCollection 2015. PLoS One. 2015. PMID: 26147107 Free PMC article.
-
Structure and thermodynamics of supported lipid membranes on hydrophobic van der Waals surfaces.Soft Matter. 2024 Jul 24;20(29):5724-5732. doi: 10.1039/d4sm00365a. Soft Matter. 2024. PMID: 38979701 Free PMC article.
-
Thermal response of Langmuir-Blodgett films of dipalmitoylphosphatidylcholine studied by atomic force microscopy and force spectroscopy.Biophys J. 2007 Oct 15;93(8):2713-25. doi: 10.1529/biophysj.107.110916. Epub 2007 Jun 22. Biophys J. 2007. PMID: 17586574 Free PMC article.
-
Phase behavior of supported lipid bilayers: A systematic study by coarse-grained molecular dynamics simulations.J Chem Phys. 2017 Apr 21;146(15):154902. doi: 10.1063/1.4981008. J Chem Phys. 2017. PMID: 28433014 Free PMC article.
-
Development, structure and mechanics of a synthetic E. coli outer membrane model.Nanoscale Adv. 2020 Dec 16;3(3):755-766. doi: 10.1039/d0na00977f. eCollection 2021 Feb 10. Nanoscale Adv. 2020. PMID: 36133844 Free PMC article.
References
-
- Anrather, D., M. Smetazko, M. Saba, Y. Alguel, and T. Schalkhammer. 2004. Supported membrane nanodevices. J. Nanosci. Nanotech. 4:1–22. - PubMed
-
- Sackmann, E. 1996. Supported membranes: scientific and practical applications. Science. 271:43–47. - PubMed
-
- Marsh, D. 1996. Lateral pressure in membranes. Biochim. Biophys. Acta. 1286:183–223. - PubMed
-
- Egawa, H., and K. Furusawa. 1999. Liposome adhesion on mica surface studied by atomic force microscopy. Langmuir. 15:1660–1666.
-
- Rädler, J., H. Strey, and E. Sackmann. 1995. Phenomenology and kinetics of lipid bilayer spreading on hydrophilic surfaces. Langmuir. 11:4539–4548.
Publication types
MeSH terms
Substances
LinkOut - more resources
Full Text Sources

