Quantitative trait locus analysis using recombinant inbred intercrosses: theoretical and empirical considerations
- PMID: 15879512
- PMCID: PMC1451174
- DOI: 10.1534/genetics.104.035709
Quantitative trait locus analysis using recombinant inbred intercrosses: theoretical and empirical considerations
Abstract
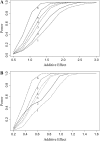
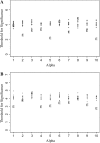
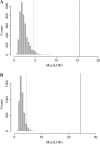
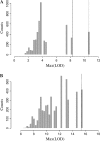
We describe a new approach, called recombinant inbred intercross (RIX) mapping, that extends the power of recombinant inbred (RI) lines to provide sensitive detection of quantitative trait loci (QTL) responsible for complex genetic and nongenetic interactions. RIXs are generated by producing F1 hybrids between all or a subset of parental RI lines. By dramatically extending the number of unique, reproducible genomes, RIXs share some of the best properties of both the parental RI and F2 mapping panels. These attributes make the RIX method ideally suited for experiments requiring analysis of multiple parameters, under different environmental conditions and/or temporal sampling. However, since any pair of RIX genomes shares either one or no parental RIs, this cross introduces an unusual population structure requiring special computational approaches for analysis. Herein, we propose an efficient statistical procedure for QTL mapping with RIXs and describe a novel empirical permutation procedure to assess genome-wide significance. This procedure will also be applicable to diallel crosses. Extensive simulations using strain distribution patterns from CXB, AXB/BXA, and BXD mouse RI lines show the theoretical power of the RIX approach and the analysis of CXB RIXs demonstrates the limitations of this procedure when using small RI panels.
Figures


Similar articles
-
Quantitative trait mapping in a diallel cross of recombinant inbred lines.Mamm Genome. 2005 May;16(5):344-55. doi: 10.1007/s00335-004-2466-1. Mamm Genome. 2005. PMID: 16104382
-
Varying coefficient models for mapping quantitative trait loci using recombinant inbred intercrosses.Genetics. 2012 Feb;190(2):475-86. doi: 10.1534/genetics.111.132522. Genetics. 2012. PMID: 22345613 Free PMC article.
-
Bayesian multiple quantitative trait loci mapping for recombinant inbred intercrosses.Genetics. 2011 May;188(1):189-95. doi: 10.1534/genetics.110.125542. Epub 2011 Mar 8. Genetics. 2011. PMID: 21385723 Free PMC article.
-
Quantitative trait locus (QTL) mapping in aging systems.Methods Mol Biol. 2007;371:321-48. doi: 10.1007/978-1-59745-361-5_23. Methods Mol Biol. 2007. PMID: 17634591 Review.
-
Use of recombinant inbred strains for studying genetic determinants of responses to alcohol.Alcohol Alcohol Suppl. 1994;2:67-71. Alcohol Alcohol Suppl. 1994. PMID: 8974318 Review.
Cited by
-
Wheat kernel dimensions: how do they contribute to kernel weight at an individual QTL level?J Genet. 2011 Dec;90(3):409-25. doi: 10.1007/s12041-011-0103-9. J Genet. 2011. PMID: 22227928
-
Mouse Systems Genetics as a Prelude to Precision Medicine.Trends Genet. 2020 Apr;36(4):259-272. doi: 10.1016/j.tig.2020.01.004. Epub 2020 Feb 6. Trends Genet. 2020. PMID: 32037011 Free PMC article. Review.
-
gQTL: A Web Application for QTL Analysis Using the Collaborative Cross Mouse Genetic Reference Population.G3 (Bethesda). 2018 Jul 31;8(8):2559-2562. doi: 10.1534/g3.118.200230. G3 (Bethesda). 2018. PMID: 29880557 Free PMC article.
-
Joint Analysis of Strain and Parent-of-Origin Effects for Recombinant Inbred Intercrosses Generated from Multiparent Populations with the Collaborative Cross as an Example.G3 (Bethesda). 2018 Feb 2;8(2):599-605. doi: 10.1534/g3.117.300483. G3 (Bethesda). 2018. PMID: 29255115 Free PMC article.
-
Conditional QTL mapping for plant height with respect to the length of the spike and internode in two mapping populations of wheat.Theor Appl Genet. 2011 May;122(8):1517-36. doi: 10.1007/s00122-011-1551-6. Epub 2011 Feb 26. Theor Appl Genet. 2011. PMID: 21359559
References
-
- Bailey, D. W., 1971. Recombinant-inbred strains. An aid to finding identity, linkage, and function of histocompatibility and other genes. Transplantation 11 325–327. - PubMed
-
- Basten, C. J., B. S. Weir and Z-B. Zeng, 1994 Zmap—a QTL cartographer, pp. 65–66 in Proceedings of the 5th World Congress on Genetics Applied to Livestock Production: Computing Strategies and Software, edited by C. Smith, J. S. Gavora, B. Benkel, J. Chesnais, W. Fairfull et al. Organizing Committee, 5th World Congress on Genetics Applied to Livestock Production, Guelph, Ontario, Canada.
-
- Belknap, J. K., 1998. Effect of within-strain sample size on QTL detection and mapping using recombinant inbred mouse strains. Behav. Genet. 28 29–38. - PubMed
-
- Broman, K. W., H. Wu, S. Sen and G. A. Churchill, 2003. R/qtl: an extensible QTL mapping environment. Bioinformatics 19 889–890. - PubMed
Publication types
MeSH terms
Grants and funding
- R01 CA079869/CA/NCI NIH HHS/United States
- R03 MH070504/MH/NIMH NIH HHS/United States
- MH062009/MH/NIMH NIH HHS/United States
- P30 ES010126/ES/NIEHS NIH HHS/United States
- P30 CA016086/CA/NCI NIH HHS/United States
- EY01299/EY/NEI NIH HHS/United States
- P20 MH062009/MH/NIMH NIH HHS/United States
- CA079869/CA/NCI NIH HHS/United States
- MH070504/MH/NIMH NIH HHS/United States
- ES011391/ES/NIEHS NIH HHS/United States
- AA013499/AA/NIAAA NIH HHS/United States
- U19 ES011391/ES/NIEHS NIH HHS/United States
- CA105417/CA/NCI NIH HHS/United States
- U01 CA105417/CA/NCI NIH HHS/United States
- ES010126/ES/NIEHS NIH HHS/United States
- U01 AA013499/AA/NIAAA NIH HHS/United States
- CA016086/CA/NCI NIH HHS/United States
LinkOut - more resources
Full Text Sources
Molecular Biology Databases
Miscellaneous

