Comparative Study
. 2005 May 1;19(9):1081-92.
doi: 10.1101/gad.1304805.

Polarity of the mouse embryo is established at blastocyst and is not prepatterned

Affiliations
Comparative Study

Polarity of the mouse embryo is established at blastocyst and is not prepatterned

Nami Motosugi et al. Genes Dev. .

Abstract

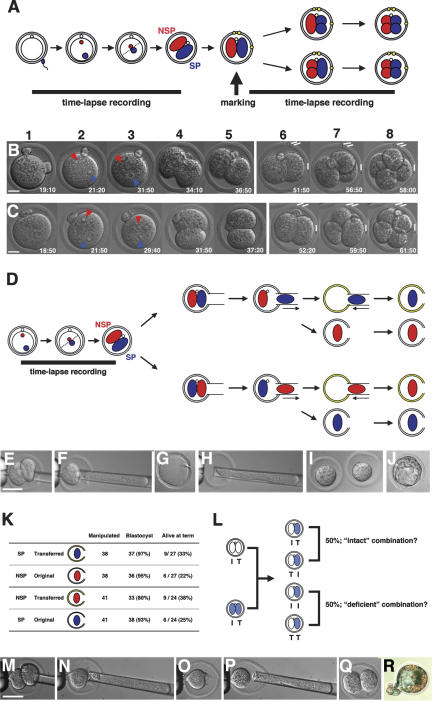
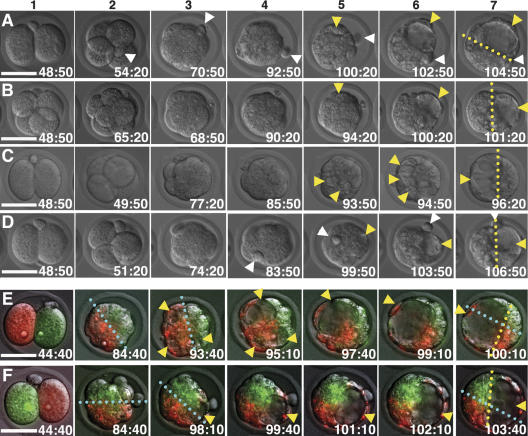
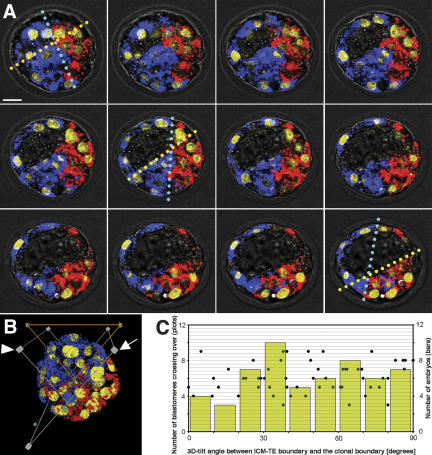
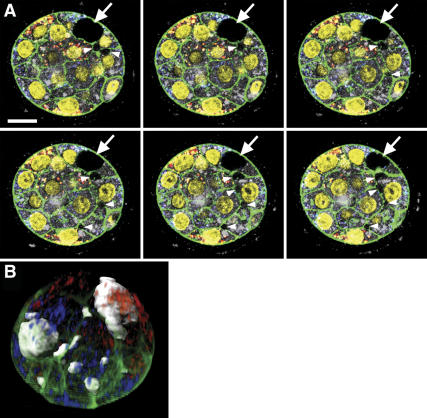
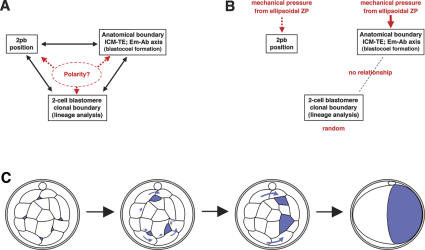
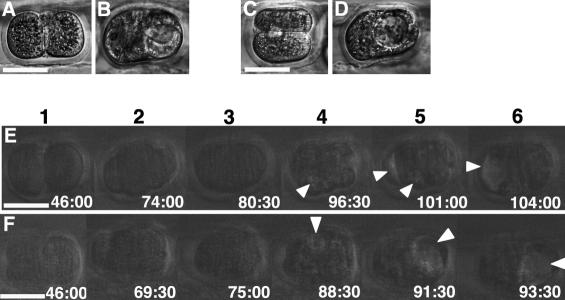
Polarity formation in mammalian preimplantation embryos has long been a subject of controversy. Mammalian embryos are highly regulative, which has led to the conclusion that polarity specification does not exist until the blastocyst stage; however, some recent reports have now suggested polarity predetermination in the egg. Our recent time-lapse recordings have demonstrated that the first cleavage plane is not predetermined in the mouse egg. Here we show that, in contrast to previous claims, two-cell blastomeres do not differ and their precise future contribution to the inner cell mass and/or the trophectoderm cannot be anticipated. Thus, all evidence so far strongly suggests the absence of predetermined axes in the mouse egg. We observe that the ellipsoidal zona pellucida exerts mechanical pressure and space constraints as the coalescing multiple cavities are restricted to one end of the long axis of the blastocyst. We propose that these mechanical cues, in conjunction with the epithelial seal in the outer cell layer, lead to specification of the embryonic-abembryonic axis, thus establishing first polarity in the mouse embryo.


Figures

Figure 1.
Figure 1.
Two-cell blastomeres do not differ in developmental potency. (A) Design of the experiment for analyzing the order in which two-cell stage blastomeres divide in relation to the SEP (see text). (B,C) An example for each type of embryo in which the SP-blastomere (B) and the NSP-blastomere (C) divides earlier. (1) Fertilization cone formation. (2) Pronuclei formation. (3) Two pronuclei apposing in the center just before pronuclear membrane breakdown. (4) First cleavage. (5) Nuclei formed in the two-cell embryo (end of first recording). (6) The same two-cell embryo after marking ZP with oil drops (white bars). (7) Earlier second cleavage. (8) Later second cleavage. (D) A scheme for the design of blastomere isolation experiments. Yellow ZP represents the empty ZP prepared from another embryo. In total, two pairs of isolated blastomeres, each originating from a single embryo, were produced. Each step of the manipulation is shown in EJ. (F) One blastomere is drawn into the pipette and detached from the other. (G) Empty ZP. (H) Transfer of one isolated blastomere into the empty ZP. (I) Isolated blastomeres in ZP. (J) A manipulated embryo developed to the blastocyst stage. (K) Result of the blastomere isolation experiments. (L) Design of the experiment for analyzing the development of chimeric two-cell stage embryos (see text). Each step of the manipulation is shown in MQ; the isolated blastomere (N) is transferred into the ZP containing another isolated blastomere from a different mouse strain (P). (Q) A chimeric two-cell embryo formed by manipulation. (R) A blastocyst developed after manipulation and stained with X-gal to visualize the blastomere of ROSA strain origin. Bars: B,C, 20μm; E,M, 50 μm.
Figure 2.
Figure 2.
Dynamic behavior of the embryo developing from two-cell to blastocyst stage. (AD) Sequential DIC images of the embryos cultured in vitro. (1) Two-cell, except for B, in which the embryo divided before the start of the time-lapse recording (see Materials and Methods). (2) Four-cell, except for B, which is eight-cell. (3) Compacted eight-cell. (4) Morula. (5) Blastocyst I stage in which blastocoel formation has started. (6) Blastocyst I stage, with cavity(ies) enlarging and shifting position. (7) Blastocyst II stage. (E,F) Sequential DIC image, superimposed with fluorescent signal, of embryos marked with fluorescence (green or red) for each blastomere at the two-cell stage and cultured in vitro. (1) Two-cell, after marking and alignment on the chamber. (2) Morula, beginning of the time-lapse recording after in vitro culture in the incubator from the two-cell stage. (3) Blastocyst I stage, when blastocoel formation starts. (47) Blastocyst I–II–III stages, when blastocoel formation advances with gradual rotation of the embryo and relocation of the blastocoels. (AF) White and yellow arrowheads indicate the 2pb and blastocoels, respectively. Yellow and cyan broken lines indicate the ICM–TE boundary and the clonal boundary, respectively. In each frame, time is given in hours:minutes after hCG injection. Bars, 50 μm.
Figure 3.
Figure 3.
Lineage analysis of two-cell blastomeres in the blastocyst. (A) Sequential confocal microscopy images (2 μm) of embryos marked with two fluorescent dyes (blue and red) for the blastomeres at the two-cell stage and stained for DNA (yellow) at the blastocyst stage. Yellow and cyan broken lines indicate the ICM–TE boundary and the clonal boundary, respectively. Note that the direction of the cyan lines varies, depending on the scanned level (see text). Bar, 20 μm. (B) Reconstructed 3D-image of the same embryo as in A showing the method of tilt-angle measurement (orange triangle lines) between the anatomical boundary and the clonal boundary (both on the gray planes). (C) Summary of the tilt-angle analysis. Each green dot represents the 3D-tilt angle for each embryo in relation to the number of blastomeres crossing the clonal boundary of the two-cell blastomeres. Yellow bars show the number of embryos in each range of the tilt angle.
Figure 4.
Figure 4.
Mechanism of blastocoel formation. (A) Sequential images of the embryos marked with two fluorescent dyes (blue and red) for the blastomeres at the two-cell stage, stained for actin (green) and DNA (yellow) at the blastocyst stage and scanned by confocal microscopy every 1 μm. The arrow indicates the relatively larger cavity visible in the stereomicroscope. The arrowhead indicates smaller cavities in the intercellular spaces. Bar, 20 μm. (B) Reconstructed 3D-image of the same embryo as in A, showing 10 cavities (gray), constructed by marking the contour in each section in A.
Figure 5.
Figure 5.
A proposed mechanism for polarity determination in the mouse preimplantation embryo. (A) View proposed by others (Gardner 1997, 2001; Piotrowska et al. 2001; Fujimori et al. 2003) concerning the relationships between the landmarks for polarity in the preimplantation embryo. (B) Our proposed view and the mechanism responsible for establishing each landmark. (C) Mechanism of blastocoel (blue) formation leading to the Em–Ab axis aligned with the long axis of the ellipsoidal ZP.
Figure 6.
Figure 6.
Experimental proof for our model. The eventual position of the blastocoel, thus Em–Ab axis, is specified by external mechanical pressure imposed by the ellipsoidal ZP. (A,C) Two-cell embryos were compressed by placing them into a slit in an agar plate, in the same direction as (A) or perpendicular to (C) the original direction. (B,D) Blastocysts developed (B from A and D from C) after in vitro culture under compression. (E,F) Sequential images of the time-lapse recordings of the compressed embryos. (1, E) Two-cell. (F) Three-cell. (2) Compacted eight-cell. (3) Morula. (4) Blastocyst I, cavity formation started. (5) Blastocyst I, cavity(ies) shifting to the long axis. (6) Blastocyst II, blastocoel relocated at one end of the long axis. White arrowheads indicate the blastocoels. In each frame, time is given in hours:minutes after hCG injection. Bars, 50 μm.

Comment in

References

    1. Alarcon V.B. and Marikawa, Y. 2003. Deviation of the blastocyst axis from the first cleavage plane does not affect the quality of mouse postimplantation development. Biol. Reprod. 69: 1208–1212. - PubMed
    1. Aziz M. and Alexandre, H. 1991. The origin of the nascent blastocoele in preimplantation mouse embryos: Ultrastructural cytochemistry and effect of chloroquine. Roux's Arch. Dev. Biol. 200: 77–85. - PubMed
    1. Beddington R.S. and Robertson, E.J. 1999. Axis development and early asymmetry in mammals. Cell 96: 195–209. - PubMed
    1. Calarco P.G. and Brown, E.H. 1969. An ultrastructural and cytological study of preimplantation development of the mouse. J. Exp. Zool. 171: 253–283. - PubMed
    1. Chroscicka A., Komorowski, S., and Maleszewski, M. 2004. Both blastomeres of the mouse 2-cell embryo contribute to the embryonic portion of the blastocyst. Mol. Reprod. Dev. 68: 308–312. - PubMed

Publication types

LinkOut - more resources