

Variations among high volume surgeons in the rate of complications after radical prostatectomy: further evidence that technique matters
- PMID: 15879851
- PMCID: PMC1855289
- DOI: 10.1097/01.ju.0000158163.21079.66
Variations among high volume surgeons in the rate of complications after radical prostatectomy: further evidence that technique matters
Abstract
Purpose: A strong association between surgeon, hospital volume and postoperative morbidity of radical prostatectomy has been demonstrated. While better outcomes are associated with high volume surgeons, the degree of variation in outcomes among surgeons has not been fully examined.
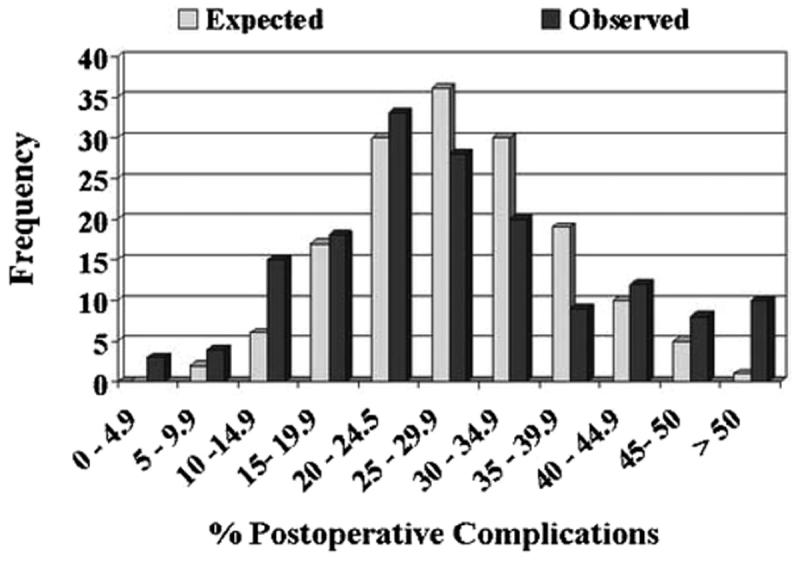
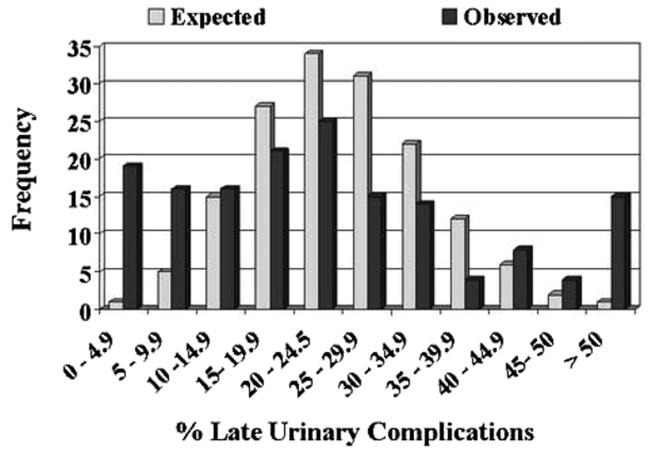
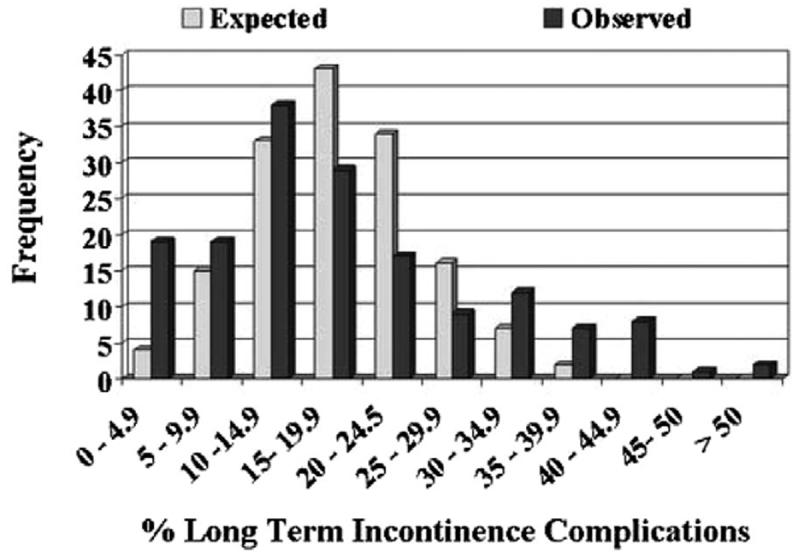
Materials and methods: Using a linked database from Surveillance, Epidemiology and End Results registries and federal Medicare claims data, we analyzed outcomes of consecutive patients treated with radical prostatectomy between 1992 and 1996. We focused on variations in several measures of morbidity (perioperative complications, late urinary complications and long-term incontinence) among patients of high volume surgeons, defined as those with 20 or more patients in the study period. After adjusting for hospital, surgeon volume and case mix, we examined the extent to which variations in the rates of adverse outcomes differed among surgeons for all 3 end points.
Results: Of the 999 surgeons 16% (159) performed 48.7% (5,238) of the 10,737 radical prostatectomies during the study. The 30-day mortality rate was 0.5%, the major postoperative complication rate was 28.6%, late urinary complications 25.2% (major events 16%) and long-term incontinence 6.7%. For all 3 morbidity outcomes the variation among surgeons in the rate of complications was significantly greater than that expected by chance (p =0.001 for each) after adjustment of covariates. Furthermore, surgeons with better (or worse) than average results with regard to 1 outcome were likely to have better (or worse, respectively) results with regard to the other 2 outcome measures.
Conclusions: Morbidity end points that directly affect quality of life showed significant variability among high volume providers. Surgeons who performed well in 1 area (eg postoperative complications) performed well in others. These results further suggest that variations in surgical technique and postoperative care lead to variations in outcomes after radical prostatectomy, indicating that outcomes of this operation are sensitive to small differences in performance.
Figures
Comment in
-
Eliminating the current Bell curve to improve the results of radical prostatectomy.J Urol. 2005 Jun;173(6):1848-9. doi: 10.1097/01.ju.0000163780.93013.6a. J Urol. 2005. PMID: 15879761 No abstract available.
References
-
- Halm EA, Lee C, Chassin MR. Is volume related to outcome in health care? A systematic review and methodologic critique of the literature. Ann Intern Med. 2002;137:511. - PubMed
-
- Birkmeyer JD, Siewers AE, Finlayson EV, Stukel TA, Lucas FL, Batista I, et al. Hospital volume and surgical mortality in the United States. N Engl J Med. 2002;346:1128. - PubMed
-
- Holm T, Johansson H, Cedermark B, Ekelund G, Rutqvist LE. Influence of hospital- and surgeon-related factors on outcome after treatment of rectal cancer with or without preoperative radiotherapy. Br J Surg. 1997;84:657. - PubMed
-
- Birkmeyer JD, Stukel TA, Siewers AE, Goodney PP, Wennberg DE, Lucas FL. Surgeon volume and operative mortality in the United States. N Engl J Med. 2003;349:2117. - PubMed
-
- Jemal A, Murray T, Samuels A, Ghafoor A, Ward E, Thun MJ. Cancerstatistics, 2003. CA Cancer J Clin. 2003;53:5. - PubMed
Publication types
MeSH terms
Grants and funding
LinkOut - more resources
Full Text Sources
Medical
