. 2005 Jun;11(6):653-60.
doi: 10.1038/nm1246. Epub 2005 May 8.

TLR activation triggers the rapid differentiation of monocytes into macrophages and dendritic cells

Affiliations

TLR activation triggers the rapid differentiation of monocytes into macrophages and dendritic cells

Stephan R Krutzik et al. Nat Med. 2005 Jun.

Abstract

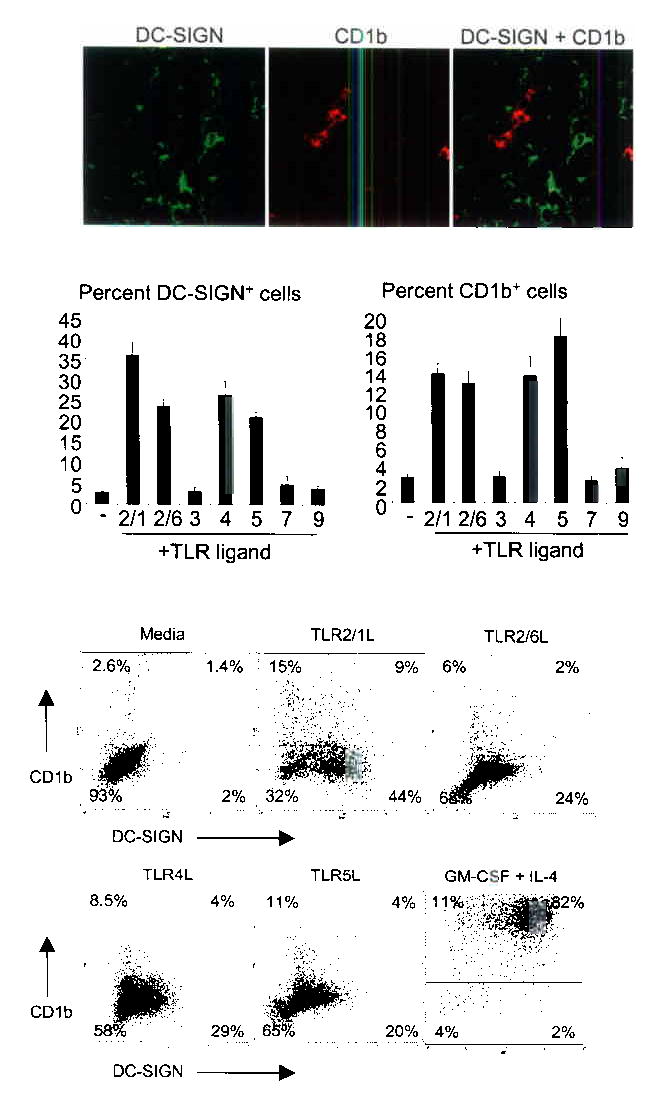
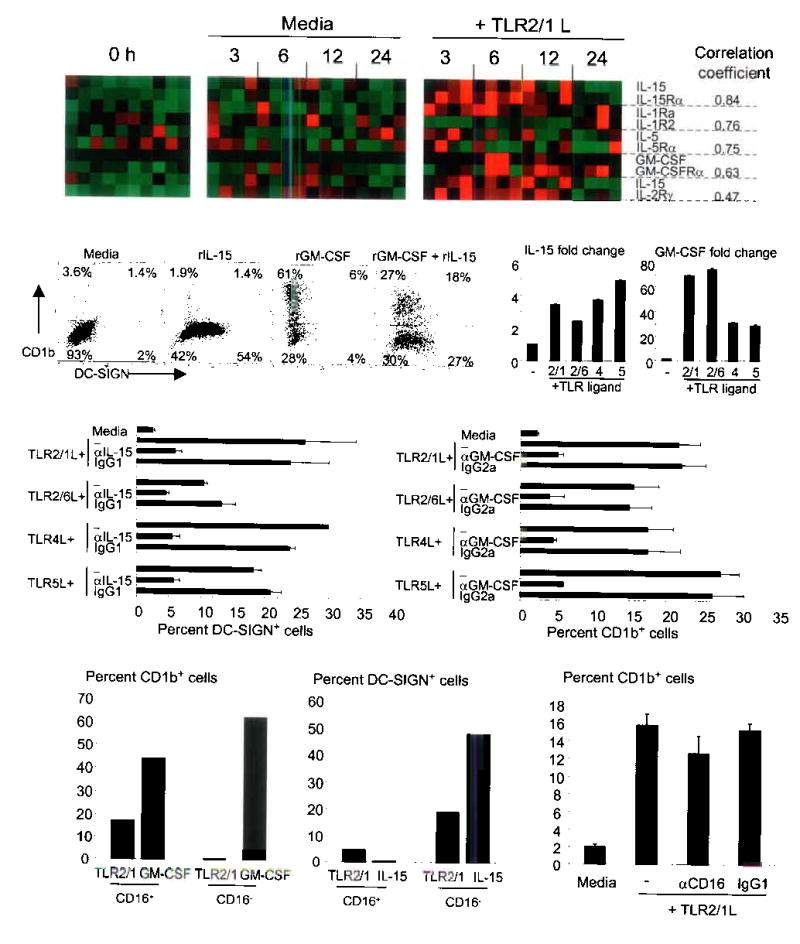
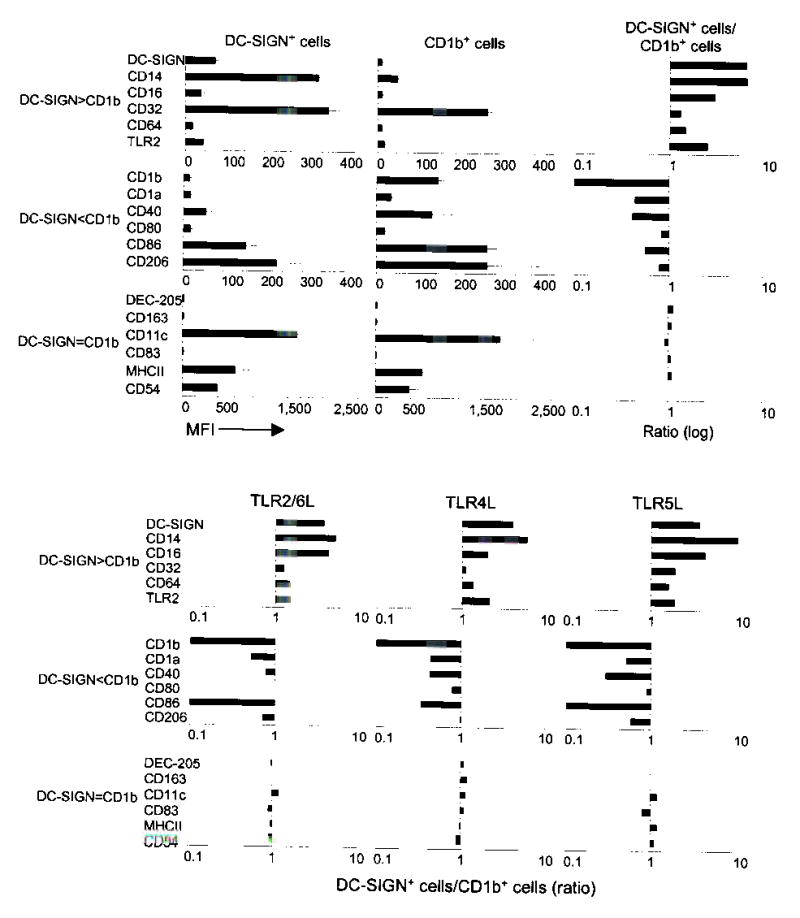
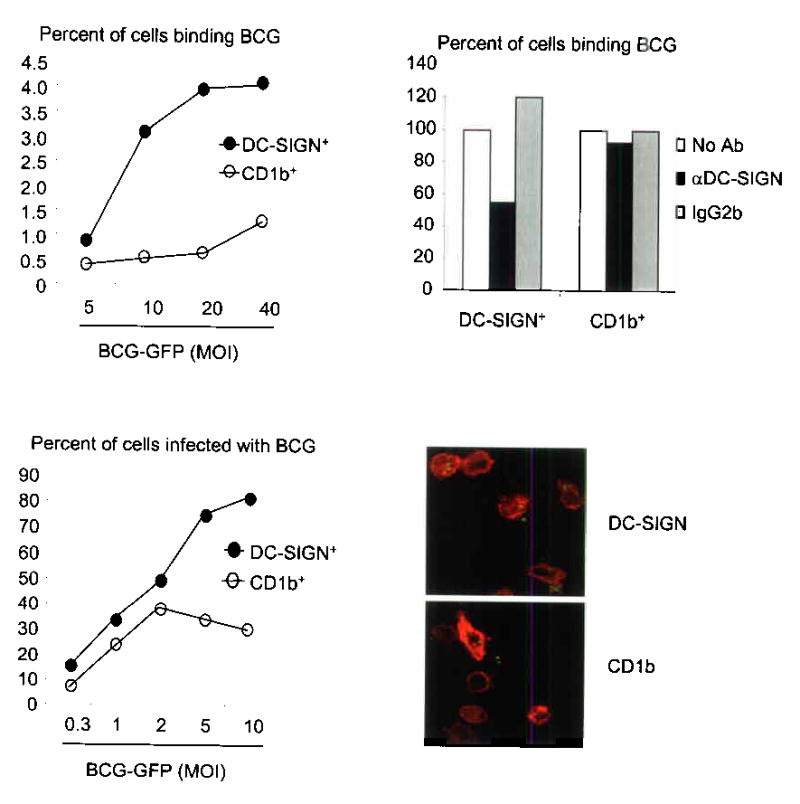
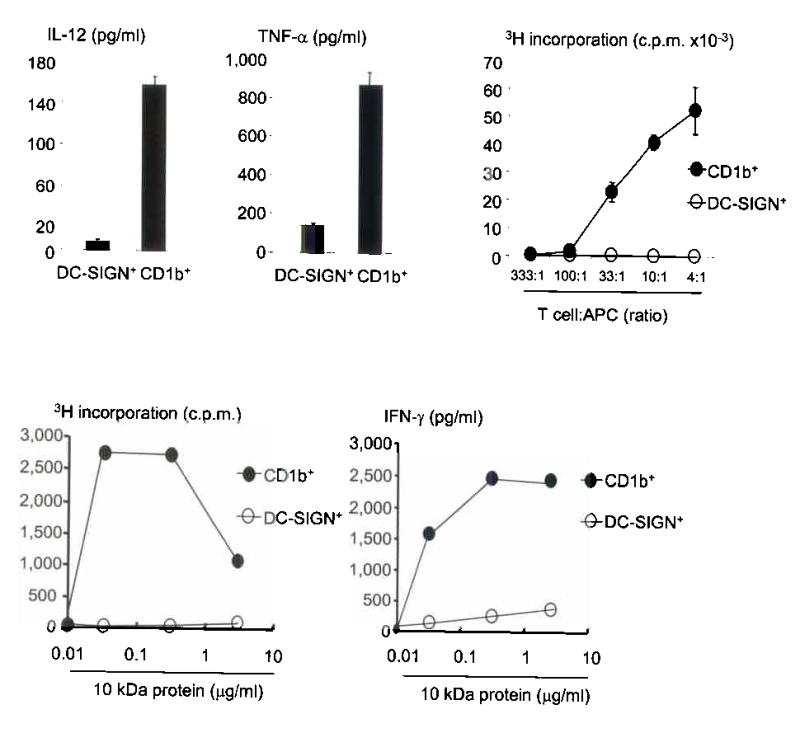
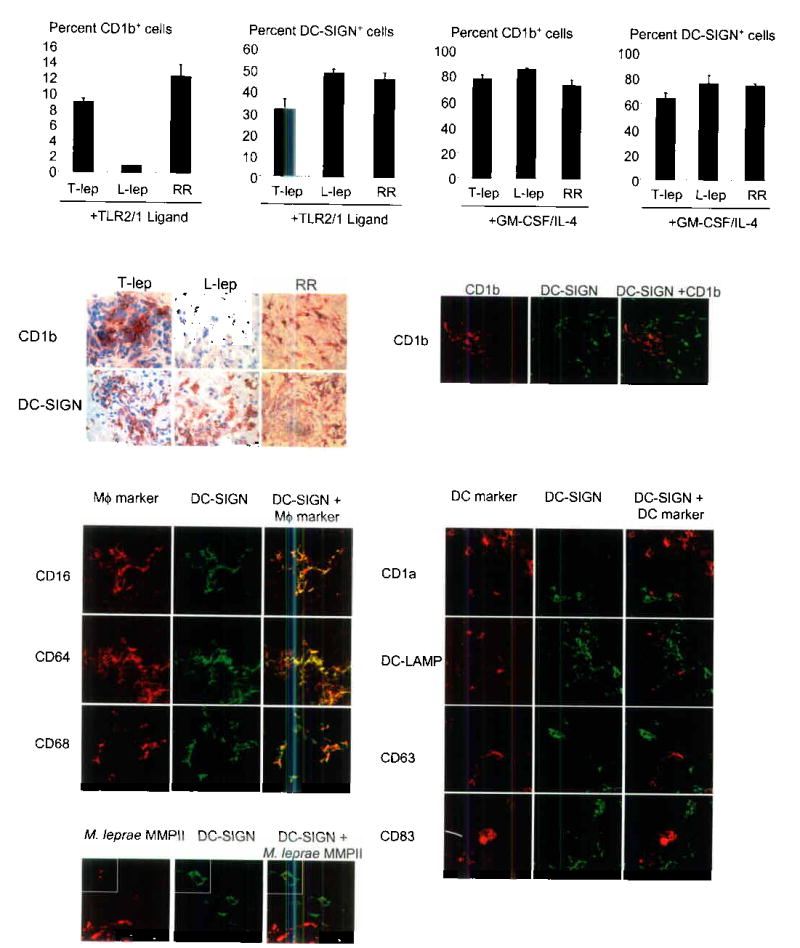
Leprosy enables investigation of mechanisms by which the innate immune system contributes to host defense against infection, because in one form, the disease progresses, and in the other, the infection is limited. We report that Toll-like receptor (TLR) activation of human monocytes induces rapid differentiation into two distinct subsets: DC-SIGN+ CD16+ macrophages and CD1b+ DC-SIGN- dendritic cells. DC-SIGN+ phagocytic macrophages were expanded by TLR-mediated upregulation of interleukin (IL)-15 and IL-15 receptor. CD1b+ dendritic cells were expanded by TLR-mediated upregulation of granulocyte-macrophage colony-stimulating factor (GM-CSF) and its receptor, promoted T cell activation and secreted proinflammatory cytokines. Whereas DC-SIGN+ macrophages were detected in lesions and after TLR activation in all leprosy patients, CD1b+ dendritic cells were not detected in lesions or after TLR activation of peripheral monocytes in individuals with the progressive lepromatous form, except during reversal reactions in which bacilli were cleared by T helper type 1 (TH1) responses. In tuberculoid lepromatous lesions, DC-SIGN+ cells were positive for macrophage markers, but negative for dendritic cell markers. Thus, TLR-induced differentiation of monocytes into either macrophages or dendritic cells seems to crucially influence effective host defenses in human infectious disease.


Figures

Figure 1
Figure 1
DC-SIGN and CD1b are expressed on distinct subsets of cells and are induced by TLR activation. (a) Human tonsil tissue sections were labeled with specific antibodies and visualized using confocal laser microscopy. Original magnification, 40X. (b) Human peripheral monocytes were activated with TLR ligands for 48 h and labeled with specific antibodies. Data are shown as the average ± SEM of between four and fourteen independent experiments. (c) Human peripheral monocytes were stimulated with TLR ligands for 48 h and double-labeled. Percent of cells in each quadrant are indicated. Data are representative of between three and 14 independent experiments.
Figure 2
Figure 2
IL-15 and GM-CSF induce monocyte differentiation. (a) TLR2/1 activation triggers cytokine ligand/receptor pairs with correlated expression. Each column represents a single donor. (b) Monocytes were cultured with recombinant cytokines. Representative data shown (n=7). (c) mRNA levels of TLR-stimulated monocytes (average of duplicate wells ± SD and representative of two donors). (d) Monocytes were stimulated with TLR ligands. Data are represented as average percent positive cells ± SEM from between two and five experiments. (e) Monocyte sub-populations were activated with either the TLR2/1L or cytokines and represent data from two independent experiments. (f) Monocytes were activated with the 19 kDa TLR2/1L in various conditions. Data represent the average (n=3) ± SEM.
Figure 3
Figure 3
DC-SIGN+ cells have a macrophage phenotype while CD1b+ cells have a dendritic cell phenotype. (a) Monocytes stimulated with the 19 kDa TLR2/1 ligand were double labeled with DC-SIGN or CD1b together with the indicated markers. Data are shown as mean fluorescence intensity (MFI) of at least four independent experiments ± SEM (left and center). Data are also represented as a ratio of expression (right) on DC-SIGN+ cells versus CD1b+ cells. (b) Monocytes were stimulated with TLR ligands, labeled as in (a) and are represented as a ratio of expression based on two to three independent experiments.
Figure 4
Figure 4
DC-SIGN+ macrophages bind and phagocytose mycobacteria. (a) Cytokine-differentiated monocytes were cultured with M. bovis BCG. Data represent percent of cells that are double positive for either DC-SIGN and BCG-GFP (filled circle) or CD1b and BCG-GFP (open circle) from two independent experiments. (b) Binding was measured in the presence of a DC-SIGN blocking antibody or controls. Data are represented as percent of binding relative to media control. (c) DC-SIGN+ and CD1b+ cells were incubated with BCG-GFP and uptake was measured by double labeling. Data is representative from two independent experiments. (d) Confocal images of cells cultured and labeled as in (c).
Figure 5
Figure 5
CD1b+ dendritic cells are producers of cytokine and potent T-cell activators. (a) Cytokine-differentiated monocytes were enriched for cells expressing DC-SIGN or CD1 and stimulated with the TLR2/1 ligand. Data represent the average of triplicate wells of two independent experiments ± SEM. (b) We obtained cells as in (a), plated them with un-matched T cells and measured proliferation (CD1b+ cells, filled circle; DC-SIGN+ cells, open circle). Data are representative of two independent experiments. (c) Antigen presenting cells added together with various concentrations of peptide and a class II-restricted T cell line, D103.5. Data are representative of two independent experiments.
Figure 6
Figure 6
Macrophage and dendritic cell subsets in leprosy. We stimulated monocytes with either (a) the 19 kDa TLR2/1L or (b) rGM-CSF and rIL-4. Data is represented as cells expressing either DC-SIGN or CD1b relative to unactivated control ± SEM (L-lep, n=6, T-lep, n=4, RR, n=6). (c) We labeled skin biopsy sections from leprosy lesions by the immunoperoxidase method. (d) Immunofluorescence confocal images from T-lep lesions. (e) Two color confocal images with macrophage markers. (f) Confocal images with dendritic cell makers. (g) Two color confocal images from L-lep lesions for the M. leprae bacterioferritin major membrane protein II (MMPII) and DC-SIGN.

References

    1. Lemaitre B, Nicolas E, Michaut L, Reichhart JM, Hoffmann JA. The dorsoventral regulatory gene cassette spatzle/Toll/cactus controls the potent antifungal response in Drosophila adults. Cell. 1996;86:973–983. - PubMed
    1. Takeuchi O, Hoshino K, Akira S. Cutting edge: TLR2-deficient and MyD88-deficient mice are highly susceptible to staphylococcus aureus infection. J Immunol. 2000;165:5392–5396. - PubMed
    1. O’Brien AD, et al. Genetic control of susceptibility to Salmonella typhimurium in mice: role of the LPS gene. J Immunol. 1980;124:20–24. - PubMed
    1. Alexopoulou L, et al. Hyporesponsiveness to vaccination with Borrelia burgdorferi OspA in humans and in. Nat Med. 2002;8:878–884. - PubMed
    1. Krutzik SR, et al. Activation and regulation of Toll-like receptors 2 and 1 in human leprosy. Nat Med. 2003;9:525–532. - PubMed

Publication types

MeSH terms