. 2005 May 9;169(3):459-70.
doi: 10.1083/jcb.200410100.

Spatial distribution and functional significance of activated vinculin in living cells

Affiliations

Spatial distribution and functional significance of activated vinculin in living cells

Hui Chen et al. J Cell Biol. .

Abstract

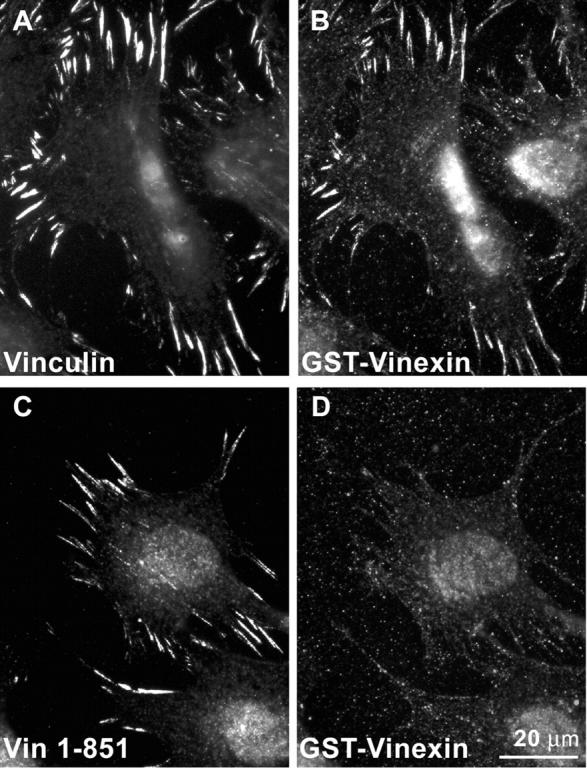
Conformational change is believed to be important to vinculin's function at sites of cell adhesion. However, nothing is known about vinculin's conformation in living cells. Using a Forster resonance energy transfer probe that reports on changes in vinculin's conformation, we find that vinculin is in the actin-binding conformation in a peripheral band of adhesive puncta in spreading cells. However, in fully spread cells with established polarity, vinculin's conformation is variable at focal adhesions. Time-lapse imaging reveals a gradient of conformational change that precedes loss of vinculin from focal adhesions in retracting regions. At stable or protruding regions, recruitment of vinculin is not necessarily coupled to the actin-binding conformation. However, a different measure of vinculin conformation, the recruitment of vinexin beta by activated vinculin, shows that autoinhibition of endogenous vinculin is relaxed at focal adhesions. Beyond providing direct evidence that vinculin is activated at focal adhesions, this study shows that the specific functional conformation correlates with regional cellular dynamics.


Figures

Figure 1.
Figure 1.
Structure and spectral properties of the FRET probes. (A) Schematic structure of vinculin FRET probes. (B) The emission spectra of vinculin1-883-EYFP-vinculin884-1066-ECFP (Tail Probe), ECFP-vinculin-EYFP (CVY), EYFP-ECFP-vinculin1-400 (control probe), and vinculin-ECFP (VC). Numbers refer to amino acid residues in chicken vinculin (Coutu and Craig, 1988). Spectra were normalized to the emission of VC at 475 nm. (C) The structures of vinculin and GFP showing the size of each molecule. The arrow marks the site of YFP insertion between residues 883 and 884.
Figure 2.
Figure 2.
Response of tail probe to ligands. The binding of actin filaments to IpaA-activated vinculin tail probe induced FRET loss, indicating a conformational change of vinculin in the tail domain. (A) Normalized fluorescence emission spectra of cell lysate from HEK 293 cells transfected with tail probe in the absence or presence of 1 μM IpaA or 5 μM actin or both. Spectra were normalized to the emission of tail probe at 475 nm. (B) Samples from A were spun in an Airfuge (Beckman Coulter) at 25 psi (130,000 g) for 35 min. Equivalent amounts of total sample before spin (T), supernatant (S), and pellet (P) fractions were subjected to SDS-PAGE and immunoblotted with hVIN1 and C4 mAbs (Sigma-Aldrich) to vinculin and actin, respectively.
Figure 3.
Figure 3.
Response of the control FRET probe YC-V 1-400 to ligands. (A) Normalized fluorescence emission spectra of cell lysates from HEK 293 cells transfected with the control FRET probe in the absence or in the presence of 1 μM IpaA or 5 μM actin or both. Spectra were normalized to emission at 475 nm of control probe alone. The control probe preserves the IpaA binding site and a focal adhesion targeting signal of vinculin but lacks the actin binding site. It does not display FRET change in response to IpaA binding. (B) Actin cosedimentation assay, performed under the same conditions as in Fig. 2 B, showed that the control probe did not bind to actin filaments under conditions in which tail probe did bind.
Figure 4.
Figure 4.
Corrected emission ratios and FRET efficiencies of vinculin FRET probes. The mean emission ratios corrected for spectral cross talk (A), and the extracted FRET efficiencies (B) were obtained as described in Materials and methods. n = 3. Error bars are the SEM.
Figure 5.
Figure 5.
Vinculin tail probe rescues spreading and lamellipodial extension on fibronectin. (A) Vinculin null cells expressing a control CFP-YFP chimera, tail probe, or untagged vinculin were allowed to spread onto 20 μg/ml of FN for 2 h at 37°C. Cells expressing untagged vinculin were stained with Vin11-5 antibody and rhodamine-conjugated secondary antibody. Cells expressing CFP-YFP and tail probe were examined by GFP fluorescence. (B–D) The extent of spreading was quantified by measuring the ratio of major/minor axis of cells (B and D) and cell areas (C and E). (B and C) Mean of the axial ratio and cell area, respectively. Error bars are the SEM. (D and E) Box plots (Chase and Brown, 1997) of B and C. Each box encloses 50% of the data with median value displayed as a horizontal line. Top and bottom of box represent the limits of ±25% of the population. Lines extending from top and bottom of boxes mark the minimum and maximum values of the data set that fall within an acceptable range. Open circles denote outliers, points whose value is either >UQ + 1.5 × IQD or <LQ − 1.5 × IQD (UQ, upper quartile; IQD, inter-quartile distance; LQ, lower quartile). Asterisks mark histograms that are statistically different from the corresponding control. The tail probe (n = 56) or untagged vinculin (n = 49) reexpressing cells are significantly (P < 0.01) more spread than vin−/− cells (n = 44).
Figure 6.
Figure 6.
Spatial distribution of activated vinculin in living cells. Vin−/− MEC transfected with tail probe (A–F) or control probe (G–L) were imaged 1 h after plating. (A and G) Localization of tail probe and control probe in MECs imaged through CFP channel. (D and J) Pseudocolored ratio (FRET/CFP) image of the cells shown in A and G. (B, E, H, and K) Enlargement of boxed region in A, D, G, and J, respectively. (C and I) The average FRET ratio measured from segmented regions of cytoplasm or focal adhesions; all segmentable focal adhesions were included. (F and L) Histograms of FRET ratios measured from the segmented focal adhesions and cytoplasm. Notably, the tail probe gave a much lower average FRET ratio (corresponding to actin-binding conformation of vinculin) in focal adhesions (B and E, boxed region) than in cytoplasm even though not all focal adhesions are distinguishable from cytoplasm. The control probe did not distinguish between the two locations (H and K, boxed region). Similar results were obtained by analysis of three other cells from a separate experiment.
Figure 7.
Figure 7.
Recruitment of vinculin to the peripheral belt of adhesion puncta during cell spreading is associated with conformational activation of vinculin. Vin−/− MECs transfected with tail probe were replated into a dish (Bioptechs) coated with 20 μg/ml fibronectin heated at 37°C. (A and B) Images of a representative cell at the initial attachment stage ∼5 min after plating. (C–F) Images of two representative cells at ∼45–60 min after plating. (A, C, and E) Localization of tail probe in each Vin−/− MEC imaged through CFP channel. (B, D, and F) Pseudocolored ratio (FRET/CFP) image of the cells shown in A, C, and E. Notably, the adherent rounded cell (A and B) gave a high FRET ratio, similar to that of cells containing control probe (Fig. 6), indicating that vinculin was largely closed in conformation at the earliest stages of spreading. During spreading, tail probe showed lower FRET ratios correlating with actin-binding conformation in adhesion structures (C–F).
Figure 8.
Figure 8.
The conformation of vinculin during focal adhesion dynamics. 24 h after plating, a fully spread smooth muscle cell was imaged at time 0, 10, 40, and 45 min. Images were corrected for photobleaching before calculation of the FRET ratio image. (A) The positions of the cell at later time points (green) relative to 0 time point (red) were displayed as color joins of CFP images. (B) Enlargement of the retraction zone from region 1 in A. Notably, as mature focal adhesions disassemble, vinculin loses the actin-bound conformation in a gradient from the tip to the base of the focal adhesions. (C) Enlargement of the focal adhesion assembly zone from region 2 in A. As focal adhesions mature, recruited vinculin does not always adopt the actin-bound conformation.
Figure 9.
Figure 9.
Vinculin binding to SH3 domains of vinexin β is conformationally regulated. (A) Vinculin, at a 1-μM concentration, was incubated in 20 mM Pipes, pH 6.9, 100 mM KCl, and 0.1% Triton X-100 with GST-vinexin (residues 42–115, encoding the first two SH3 domains of vinexin) immobilized on glutathione-agarose beads in the presence of varying amounts of IpaA. After an overnight incubation at 4°C, supernatant (S) and pellet (P) were fractionated by centrifugation for 2 min at 10,000 g. The resin was washed twice with binding buffer before elution in Laemmli sample buffer. Equal loading of pellets and supernatants represent 10% of total reaction. Samples were analyzed by SDS-PAGE and Coomassie staining. (B) Densitometry-based quantification of vinculin–vinexin interaction based on digitized Coomassie blue–stained gel analyzed in NIH Image. (C) Coomassie-stained gel of negative controls for binding experiment shown in A. IpaA was incubated with GST-vinexin in the absence of vinculin, demonstrating that no direct interaction occurs. Furthermore, the vinculin–IpaA complex does not co-sediment with GST alone, demonstrating the specificity of the ternary complex with vinexin.
Figure 10.
Figure 10.
Vinculin mediates vinexin β recruitment to focal adhesions. Vinculin null cells were permeabilized with 0.05% digitonin and incubated with 10 μg/mL GST-vinexin β (residues 1–329, encoding full-length vinexin) and 25 μg/mL vinculin (A and B) or Vh (C and D) in 25 mM MES, pH 6.0, 3 mM MgCl2, and 1 mM EGTA. Vinculin localization was visualized by staining with 5 μg/mL of 3.24 monoclonal antivinculin, followed by Rhodamine red-X–conjugated donkey anti–mouse IgG (A and C). Vinexin was visualized by staining with 5 μg/mL of polyclonal anti-GST followed by Oregon green–conjugated donkey anti–rabbit IgG (B and D). In the presence of full-length vinculin, vinexin β becomes strongly enriched in focal adhesions. However, vinexin β fails to target to focal adhesions in the presence of Vh, which lacks the polyproline region required for a direct interaction with vinexin.

Similar articles

Cited by

References

    1. Alenghat, F.J., B. Fabry, K.Y. Tsai, W.H. Goldmann, and D.E. Ingber. 2000. Analysis of cell mechanics in single vinculin-deficient cells using a magnetic tweezer. Biochem. Biophys. Res. Commun. 277:93–99. - PubMed
    1. Bakolitsa, C., J.M. de Pereda, C.R. Bagshaw, D.R. Critchley, and R.C. Liddington. 1999. Crystal structure of the vinculin tail suggests a pathway for activation. Cell. 99:603–613. - PubMed
    1. Bakolitsa, C., D.M. Cohen, L.A. Bankston, A.A. Bobkov, G.W. Cadwell, L. Jennings, D.R. Critchley, S.W. Craig, and R.C. Liddington. 2004. Structural basis for vinculin activation at sites of cell adhesion. Nature. 430:583–586. - PubMed
    1. Balaban, N.Q., U.S. Schwarz, D. Riveline, P. Goichberg, G. Tzur, I. Sabanay, D. Mahalu, S. Safran, A. Bershadsky, L. Addadi, and B. Geiger. 2001. Force and focal adhesion assembly: a close relationship studied using elastic micropatterned substrates. Nat. Cell Biol. 3:466–472. - PubMed
    1. Barstead, R.J., and R.H. Waterston. 1991. Vinculin is essential for muscle function in the nematode. J. Cell Biol. 114:715–724. - PMC - PubMed

Publication types

MeSH terms