Comparative Study
. 2005 May 17;102(20):7350-5.
doi: 10.1073/pnas.0500003102. Epub 2005 May 9.

Functional organization of human occipital-callosal fiber tracts

Affiliations
Comparative Study

Functional organization of human occipital-callosal fiber tracts

Robert F Dougherty et al. Proc Natl Acad Sci U S A. .

Abstract

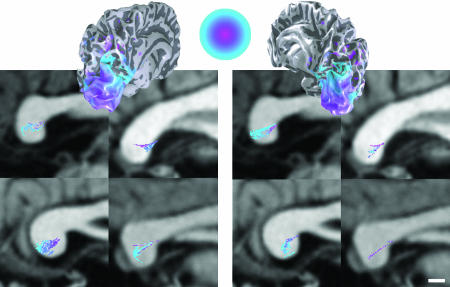
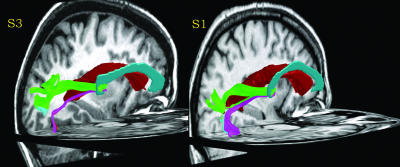
Diffusion tensor imaging (DTI) and fiber tracking (FT) were used to measure the occipital lobe fiber tracts connecting the two hemispheres in individual human subjects. These tracts are important for normal vision. Also, damage to portions of these tracts is associated with alexia. To assess the reliability of the DTI-FT measurements, occipital-callosal projections were estimated from each subject's left and right hemispheres independently. The left and right estimates converged onto the same positions within the splenium. We further characterized the properties of the estimated occipital-callosal fiber tracts by combining them with functional MRI. We used functional MRI to identify visual field maps in cortex and labeled fibers by the cortical functional response at the fiber endpoint. This labeling reveals a regular organization of the fibers within the splenium. The dorsal visual maps (dorsal V3, V3A, V3B, V7) send projections through a large band in the middle of the splenium, whereas ventral visual maps (ventral V3, V4) send projections through the inferior-anterior corner of the splenium. The agreement between the independent left/right estimates, further supported by previous descriptions of homologous tracts in macaque, validates the DTI-FT methods. However, a principal limitation of these methods is low sensitivity: a large number of fiber tracts that connect homotopic regions of ventral and lateral visual cortex were undetected. We conclude that most of the estimated tracts are real and can be localized with a precision of 1-2 mm, but many tracts are missed because of data and algorithm limitations.


Figures

Fig. 1.
Fig. 1.
Noncommutative nature of fiber tracking algorithms. The illustration shows a set of sampled diffusion tensors, drawn in two-dimensions (ellipses). Seeding locations A, B, and C will result in multiple fibers that converge onto P. However, seeding only P will result in one fiber between P and A.
Fig. 2.
Fig. 2.
Selecting occipital-callosal fiber tracts (subject S3). (A) Fiber tracts originating in seed points in the left occipital lobe. A VOI was selected in the left occipital lobe white matter. The red region in the upper image shows the VOI in a coronal slice. The three-dimensional renderings show two views of the fiber tract estimates. The cyan structure shown at the midline represents the corpus callosum. Only tracts exceeding 2 cm are shown. Fiber tracts that connect homotopic regions between the lateral and ventral surface are missing, presumably because of limitations in the methodology. (B) The subset of left occipital fibers that pass through the callosum. The Lower Left Inset (yellow box) shows the mid-sagittal plane. Blue regions indicate the pixels with at least one fiber passing through. Note that all of these occipital fibers pass through the lower half of the splenium. (Scale bar, 5 mm.)
Fig. 3.
Fig. 3.
Agreement of left and right estimated occipital-callosal fiber positions in four subjects. A mid-sagittal slice containing the corpus callosum is shown, with the splenium on the right. Red indicates the positions of left occipital fibers, blue indicates the positions of right occipital fibers, and purple indicates the region of overlap. (Scale bar, 5 mm.)
Fig. 4.
Fig. 4.
Occipital-callosal fibers labeled by the position of the endpoint with respect to cortical visual field maps. (Inset) The locations of four cortical ROIs: dorsal V3, V3A, V3B, and V7 (green), dorsal V1 and V2 (cyan), ventral V1 and V2 (magenta), and ventral V3 and hV4 (red). The four main images show a mid-sagittal slice for each subject. In these images, the fiber positions are colored according to the cortical ROI closest to the fiber endpoint. For the left occipital-callosal fibers, the leftmost endpoint is compared to the left hemisphere ROIs, and correspondingly for the right. The estimated callosal positions of fibers associated with each of the ROIs are similar for left and right hemispheres, so the union of the left and right estimates is shown. All fibers with an endpoint within 2 mm of one of these cortical regions are included. (Scale bar, 5 mm.)
Fig. 5.
Fig. 5.
Dorsal occipital-callosal fibers labeled by the position of the endpoint with respect to the cortical eccentricity representation. Typical eccentricity maps measured by using fMRI data are shown in two hemispheres (subject S4). The color map shows the representation to 16° eccentricity (purple, fovea; cyan, periphery). The image sections show the splenium of the corpus callosum from four subjects. Estimates from the left and right hemispheres are shown at Left and Right, respectively. All occipital-callosal fibers with an endpoint within 2 mm of the dorsal region, comprising V3, V3A, V3B, and V7, are colored according to the eccentricity data. Other details are as in Fig. 4.
Fig. 6.
Fig. 6.
Three-dimensional renderings of the path followed by the occipital-callosal fiber tracts in the left hemisphere of two subjects. The left lateral ventricle is rendered in red. The corpus callosum is rendered in cyan. For clarity, only the left hemisphere portion of the fiber tracts is shown. The fiber tracts are labeled with the same color scheme as in Fig. 4.
Fig. 7.
Fig. 7.
Splenial fibers in the macaque traced using autoradiography. Lateral (Left) and medial (Right) views of a left hemisphere are shown. The black blobs on the cortical surface indicate the tracer injection zones, and the dots in the corpus callosum (CC) indicate the labeled splenial fibers. These “area 19” injections appear to be primarily in dorsal visual areas, including dorsal V3 and quite likely V3A. Compare the labeled splenial region in macaque to the splenial map of the dorsal area projections in human (Fig. 4). (Modified from figure 1C of ref. .)

References

    1. Rockland, K. S. & Pandya, D. N. (1986) Brain Res. 365, 174-178. - PubMed
    1. Shipp, S. & Zeki, S. (1985) Nature 315, 322-325. - PubMed
    1. Miklossy, J., Clarke, S. & Van der Loos, H. (1991) J. Neuropathol. Exp. Neurol. 50, 595-614. - PubMed
    1. Clarke, S. & Miklossy, J. (1990) J. Comp. Neurol. 298, 188-214. - PubMed
    1. Basser, P. J., Pajevic, S., Pierpaoli, C., Duda, J. & Aldroubi, A. (2000) Magn. Reson. Med. 44, 625-632. - PubMed

Publication types