. 2005 Jun;115(2):170-8.
doi: 10.1111/j.1365-2567.2005.02145.x.

The negative regulatory function of the lymphocyte-activation gene-3 co-receptor (CD223) on human T cells

Affiliations

The negative regulatory function of the lymphocyte-activation gene-3 co-receptor (CD223) on human T cells

Laëtitia Maçon-Lemaître et al. Immunology. 2005 Jun.

Abstract

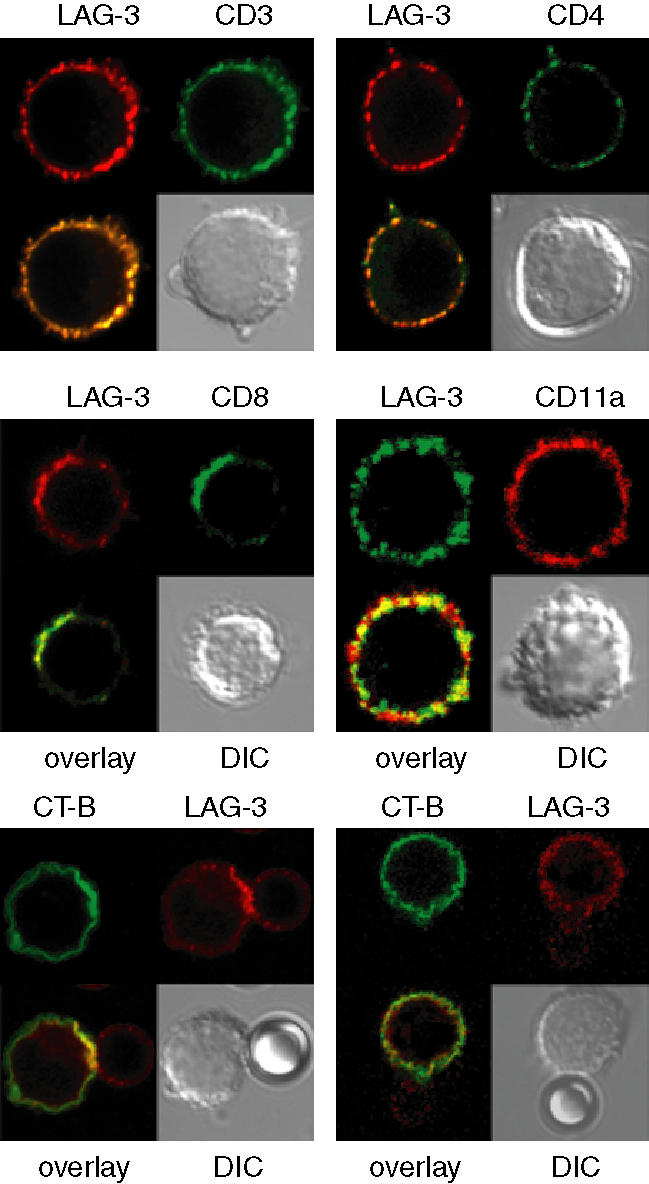
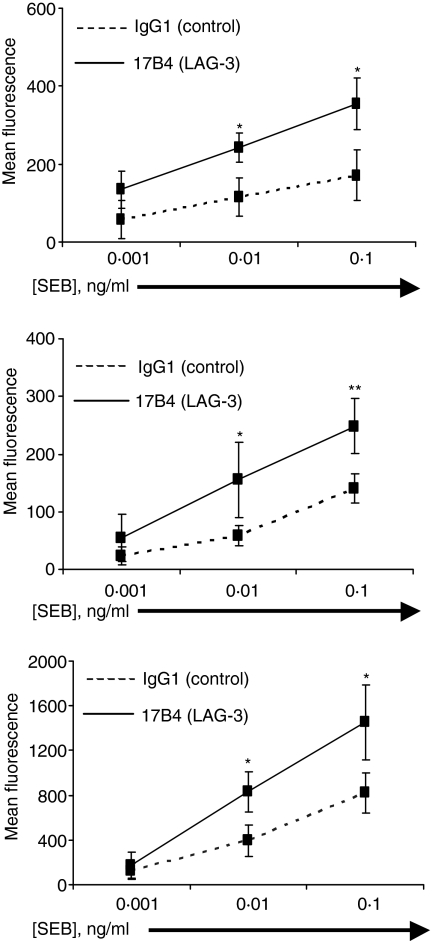
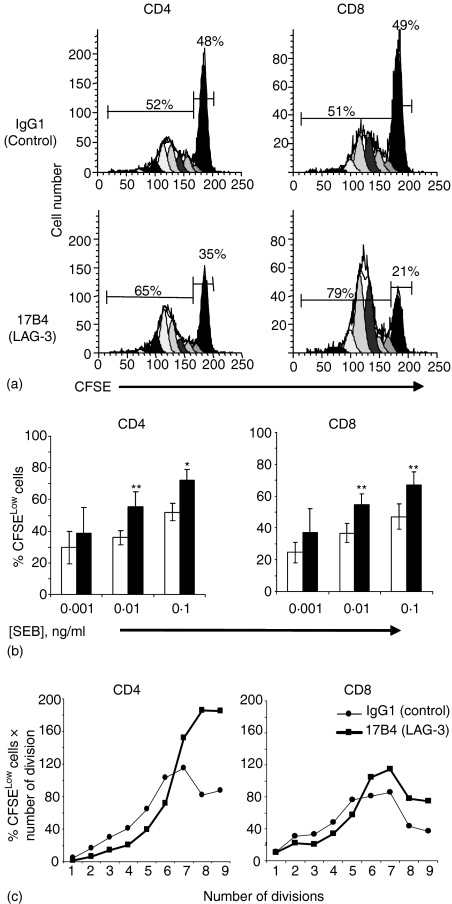
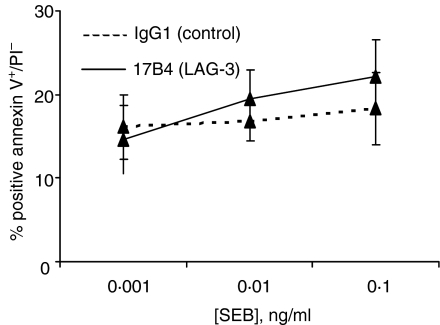
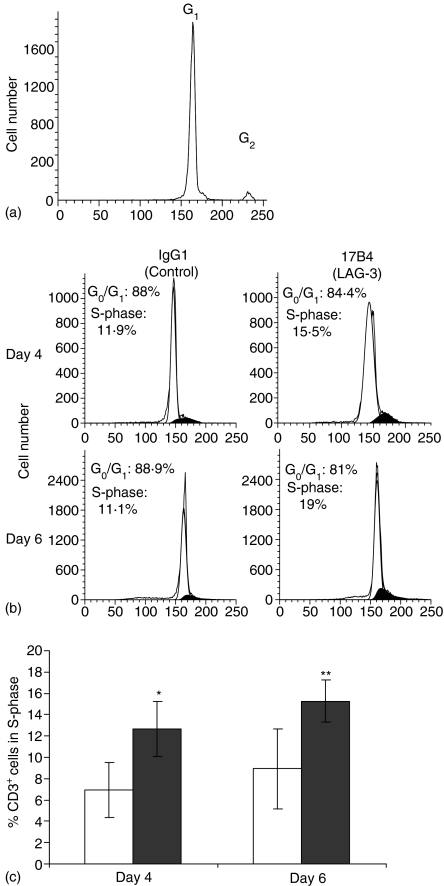
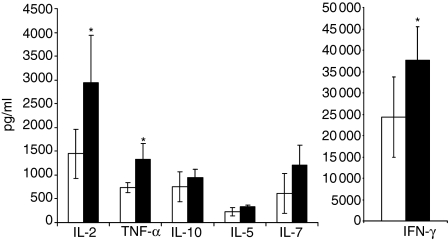
Accumulating evidence indicates that the CD4 homologue lymphocyte activation gene-3 (LAG-3) plays a down-regulatory role on T-cell responses. However, the role of LAG-3/major histocompatibility complex (MHC) class II interactions on primary human T-cell responses, as well as the mechanism by which down-regulation occurs, are not clear. Here, we show that LAG-3 colocalized with CD3, CD4 or CD8 in areas of cholesterol-rich raft aggregation during this primary response, as well as in the clustered raft region formed between T cells and antibody-coated beads. Addition of a blocking LAG-3-specific monoclonal antibody to both CD4 and CD8 primary resting T cells activated under conditions of antigen-presenting cell-driven stimulation and low antigen concentrations augments CD69 activation antigen expression, T-cell expansion and T helper 1 (Th1, but not Th2) cytokine production. Blocking LAG-3/MHC class II interactions leads to an increase in the number of cells entering division at these low concentrations of antigen and to more rounds of divisions with an accumulation of cells in the S-phase of the cell cycle. These results indicate that LAG-3 signalling inhibits early events in primary activation of human CD4 and CD8 T cells and further support a role for LAG-3 signalling in regulating the expansion of activated effector or memory T cells, either directly or indirectly through Treg suppressor activity.


Figures

Figure 1
Figure 1
LAG-3 colocalizes in GSL complexes with CD3, CD4 or CD8, and in the IS with CD3 and GM1 after TCR engagement. (a) PRMC's stimulated for two days with SEB were labelled with LAG-3-specific mAb followed by staining with Alexa Fluor 488-goat anti-mouse IgG1 (green) or Alexa Fluor 594-GAM IgG1 (red) and with FITC-CD3-, CD4- or CD8-specific mAb. PE-CD11a-specific mAb was used as negative control. (b) LAG-3-transfected Jurkat cells were stimulated with (left) or without (right) OKT3 plus CD28 mAbs coated-beads for 30 min at 37°. Cells were then fixed and stained with FITC-CTB and LAG-3-specific mAb followed by staining with Alexa Fluor 546-GAM (red). Beads are coloured in red in the left hand panel because of the staining of CD28 mAb (IgG1) by Alexa Fluor 546-GAM. DIC, differential interferential contrast. The pictures are representative of the results obtained in three independent experiments.
Figure 2
Figure 2
Inhibition of LAG-3/MHC class II interactions leads to increased CD69 expression in both CD4+ and CD8+ SEB-stimulated PBMC cell subsets. PBMCs were stimulated with indicated concentration of SEB for 2 days in the presence of LAG-3-specific mAb or control IgG1 mAb. PBMC were stained with PE-CD4 or PE-CD8 and FITC-CD69. CD69 expression on total PBMCs (a), CD4+ (b) or CD8+ (c) subsets of gated PBMC was determined by FACS using FITC-CD69 mAb. Results are mean of 6 experiments performed on different PBMC samples with *P < 0·05 and **P < 0·01.
Figure 3
Figure 3
Inhibition of LAG-3/MHC class II interactions increases cell division in CD4+ and CD8+ SEB-stimulated PBMC cell subsets. CFSE-labelled PBMC were cultured with 0·1 ng/ml SEB for 4 days. (a) ModFit Verity software analysis of CFSE staining in CD4+ and CD8+ SEB-stimulated PBMC subsets. (b) The ‘total percent divisions of CFSELow’, that is the sum of the percentage of CD4+ or CD8+ cells in each division peak without the parental generation, are shown for the LAG-3-specific 17B4 mAb (filled histograms) or the control IgG1 mAb (empty histograms). Results are mean of six experiments performed on different PBMC samples. *P < 0·05 and **P < 0·01. (c) The slight shift to the left of the dividing cells CFSELow peaks in (a) is shown by using weighted scores calculated by multiplying the ‘total percent divisions of CFSELow’ by the number of cell divisions.
Figure 4
Figure 4
Inhibiting LAG-3/MHC class II interactions does not induce apoptosis after SEB stimulation. PBMC were stimulated with indicated concentration of SEB for 2 days in the presence of LAG-3-specific mAb or control IgG1 mAb. FITC-annexin V+/PI cells represent the apoptotic cell subset. Results are mean of percentage of six independent experiments.
Figure 5
Figure 5
Inhibiting LAG-3/MHC class II interactions increases the percentage of cells in S-phase of the cell cycle in SEB-stimulated PBMC. PBMC were cultured with or without 0·1 ng/ml SEB for 6 days and stained with FITC-CD3 mAb and PI. The ModFit Verity software was used to determine fractions of population in each phase of the cell cycle. G0/G1 (white area) and S-phases (black area). (a) Histograms of DNA content in CD3+ cells of a representative experiment used to determine the relative position of the G2 peak compared to the G1 peak in unstimulated cultures (no SEB). (b) Histograms of DNA content in CD3+ cells of a representative experiment (0·1 ng/ml SEB) (c) Percentage of CD3+ cells in the S-phase of the cell cycle following culture with LAG-3-specific 17B4 mAb (filled histograms) or control IgG1 mAb (empty histograms) Results are mean of six independent experiments. *P < 0·05 and **P < 0·01.
Figure 6
Figure 6
Inhibition of LAG-3/MHC class II interactions increases Th1, but not Th2, cytokine production. PBMC were cultured with 0·1 ng/ml of SEB and with LAG-3-specific 17B4 mAb (filled histograms) or control IgG1 mAb (empty histograms). At 48 hr, supernatants were collected and cytokine assays were performed using microparticle-based flow cytometry analysis. Results are mean of six experiments performed on different PBMC samples. *P < 0·05.

References

    1. Viola A, Schroeder S, Sakakibara Y, Lanzavecchia A. T lymphocyte costimulation mediated by reorganization of membrane microdomains. Science. 1999;283:680–2. - PubMed
    1. Xavier R, Brennan T, Li Q, McCormack C, Seed B. Membrane compartmentation is required for efficient T cell activation. Immunity. 1998;8:723–32. - PubMed
    1. Bi K, Tanaka Y, Coudronniere N, Sugie K, Hong S, van Stipdonk MJ, Altman A. Antigen-induced translocation of PKC-theta to membrane rafts is required for T cell activation. Nat Immunol. 2001;2:556–63. - PubMed
    1. Darlington P, Baroja M, Chau T, Siu E, Ling V, Carreno B, Madrenas J. Surface cytotoxic T lymphocyte-associated antigen 4 partition within lipid rafts and relocates to the immunological synapse under conditions of inhibition of T cell activation. J Exp Med. 2002;195:1337–47. - PMC - PubMed
    1. Triebel F, Jitsukawa S, Baixeras E, Roman-Roman S, Genevée C, Viegas-Pequignot E, Hercend T. LAG-3, a novel lymphocyte activation gene closely related to CD4. J Exp Med. 1990;171:1393–405. - PMC - PubMed

MeSH terms