. 2005 Jul;16(7):3425-37.
doi: 10.1091/mbc.e04-10-0951. Epub 2005 May 11.

Specific features of neuronal size and shape are regulated by tropomyosin isoforms

Affiliations

Specific features of neuronal size and shape are regulated by tropomyosin isoforms

Galina Schevzov et al. Mol Biol Cell. 2005 Jul.

Abstract

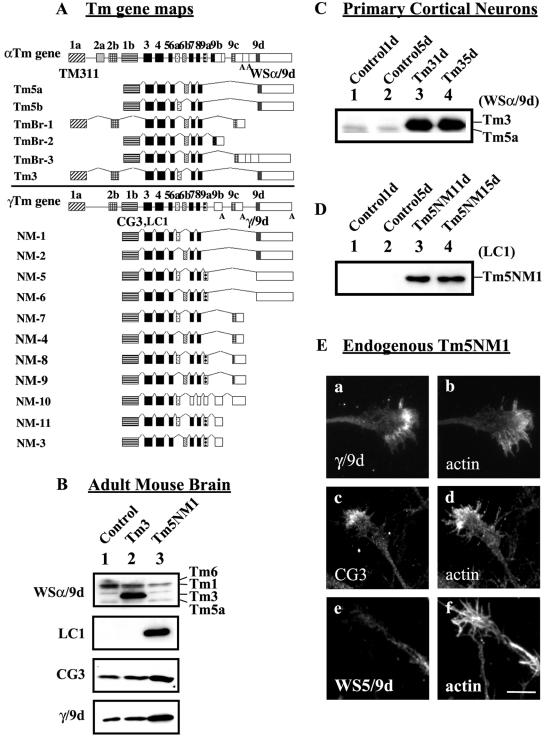
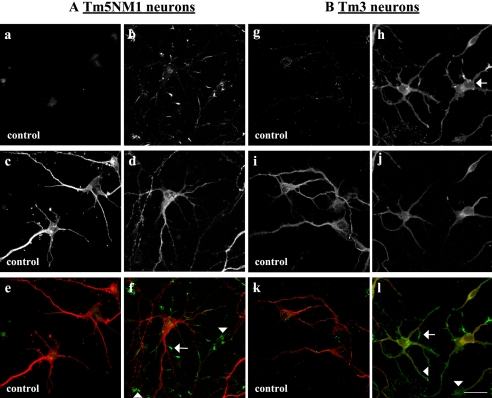
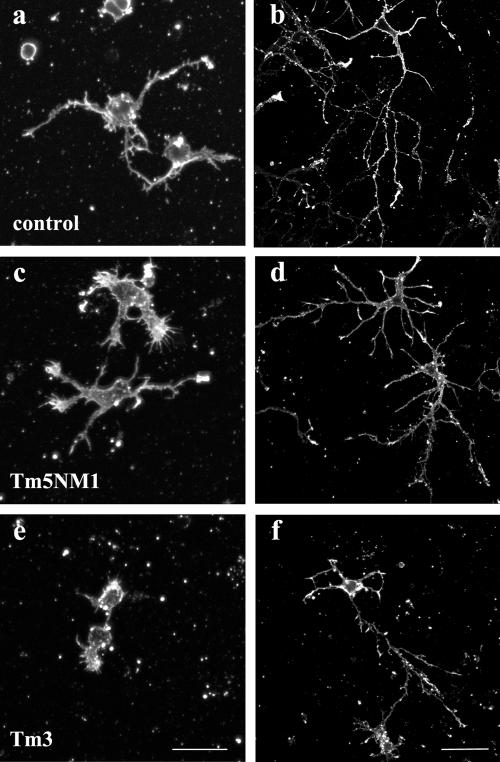
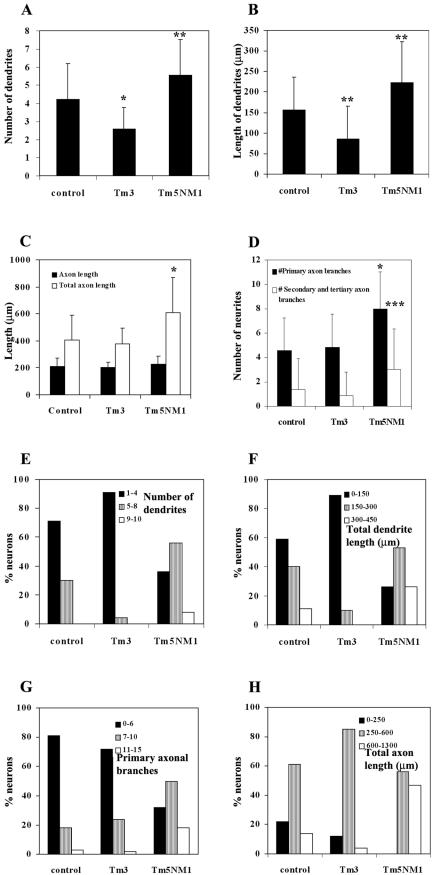
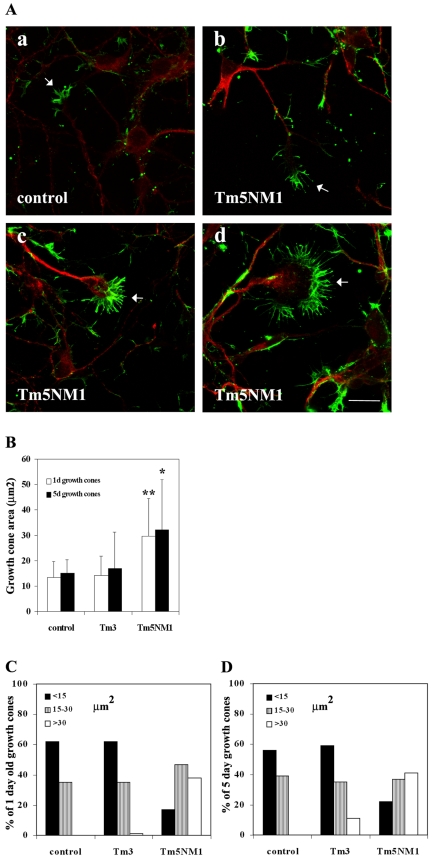
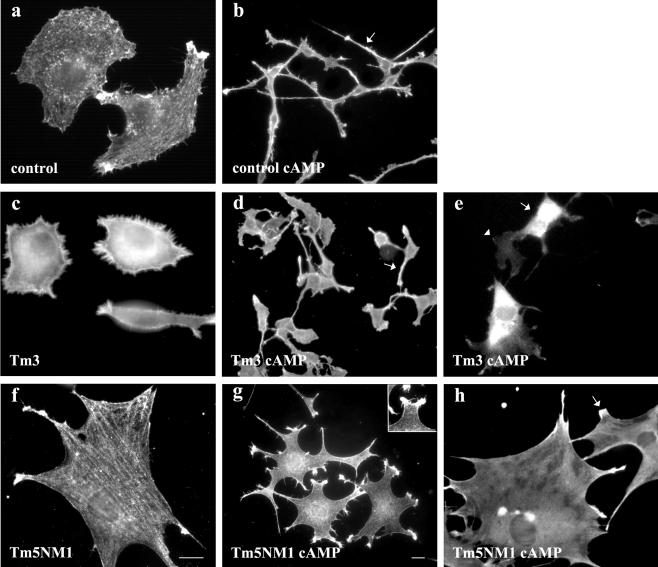
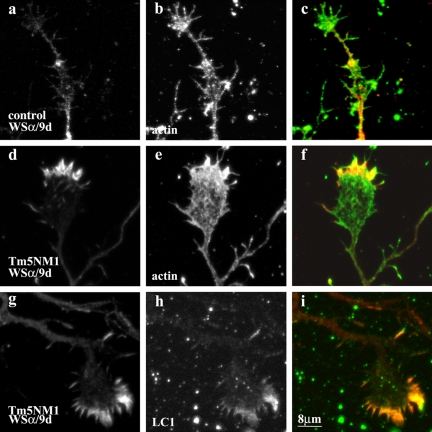
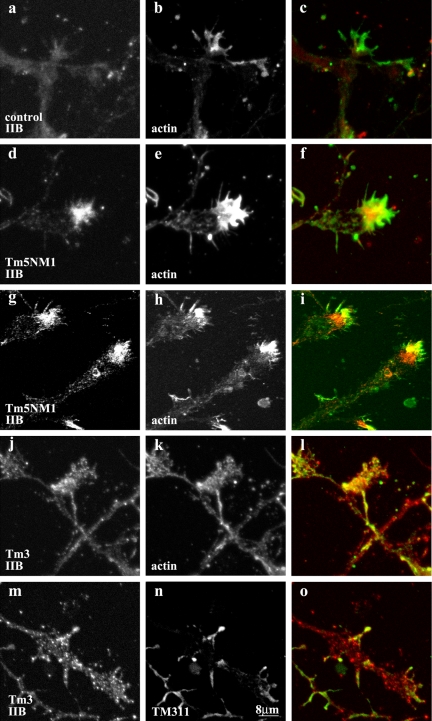
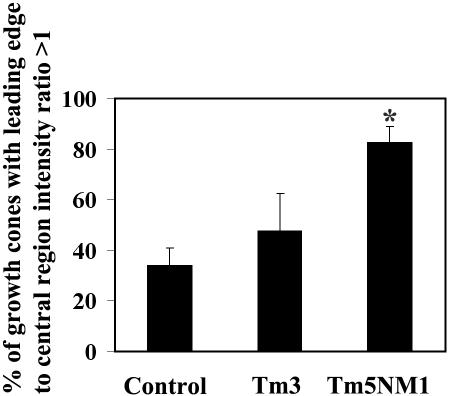
Spatially distinct populations of microfilaments, characterized by different tropomyosin (Tm) isoforms, are present within a neuron. To investigate the impact of altered tropomyosin isoform expression on neuronal morphogenesis, embryonic cortical neurons from transgenic mice expressing the isoforms Tm3 and Tm5NM1, under the control of the beta-actin promoter, were cultured in vitro. Exogenously expressed Tm isoforms sorted to different subcellular compartments with Tm5NM1 enriched in filopodia and growth cones, whereas the Tm3 was more broadly localized. The Tm5NM1 neurons displayed significantly enlarged growth cones accompanied by an increase in the number of dendrites and axonal branching. In contrast, Tm3 neurons displayed inhibition of neurite outgrowth. Recruitment of Tm5a and myosin IIB was observed in the peripheral region of a significant number of Tm5NM1 growth cones. We propose that enrichment of myosin IIB increases filament stability, leading to the enlarged growth cones. Our observations support a role for different tropomyosin isoforms in regulating interactions with myosin and thereby regulating morphology in specific intracellular compartments.


Figures

Figure 1.
Figure 1.
Organization of Tm genes, their expression in transgenic mice, and subcellular localization in neurons. (A) Schematic representation of the organization of the α, and γ mammalian Tm genes and the respective neuronal isoforms. Exons, shaded boxes, are numbered 1–9; unshaded boxes correspond to 3′ untranslated sequences; and introns are shown as lines. The black shaded exons are common to all genes. The name of the Tm antibody is indicated in bold below the exon where the epitope is found. (B, C, and D) Equal loading (10 μg) of total cellular protein was isolated and electrophoresed on a 12.5% low-bis SDS-PAGE gel. (B) Immunoblots of adult mouse brain. Lane 1, control brain; lane 2, Tm3 transgenic; and lane 3, Tm5NM1 were probed with WSα/9d to detect Tm3, LC1 to detect the exogenous Tm5NM1, CG3 to detect all products from the γTm gene, and γ/9d to detect Tm5NM1 and Tm5NM2. (C) Immunoblot of Tm3 primary cortical neurons. Lane 1, control 1 d old; lane 2, control 5 d; lane 3, Tm3 1 d; and lane 4, Tm3 5 d, probed with the WSα/9d antibody. (D) Immunoblot of Tm5NM1 primary cortical neurons. Lane 1, control 1 d old; lane 2, control 5 d; lane 3, Tm5NM1 1 d; and lane 4, Tm5NM1 5 d, probed with the LC1 antibody. (E) Endogenous Tm5NM1 sorts to the peripheral region of the growth cone unlike Tm5NM2. Control primary cortical neurons cultured for 5 d were double immunofluorescence stained with γ/9d (a), actin (b), CG3 (c), actin (d), WS5/9d (e), and actin (f). Bar, 10 μm.
Figure 2.
Figure 2.
Subcellular localization of the exogenous Tm5NM1 and Tm3. Primary cortical neurons were cultured in vitro for 5 d and double immunofluorescence stained with the LC1 antibody to visualize the exogenous Tm5NM1 (green) or TM311 antibody to visualize the exogenous Tm3 (green) and WS5/9d (red), which tracks with the endogenous Tm5NM2. (A) The exogenous Tm5NM1 (b and f) was enriched in the filopodia, (f, arrow), and the peripheral regions of growth cones (f, arrowheads). In contrast control neurons showed no such staining (a, c, and e). (e) Merged image of a (green) and c (red). (f) Merged image of b (green) and d (red). (B) The exogenous Tm3 protein was preferentially enriched in the filopodia (l, arrow), the peripheral region of the growth cone (l, arrowhead), and the cell body (h, arrow). In contrast, control neurons showed no such staining (g and k). (k) Merged image of g (green) and i (red). (l) Merged image of h (green) and j (red). Bar, 40 μm.
Figure 3.
Figure 3.
Differential impact of tropomyosin isoforms on neuronal morphogenesis. Primary cortical neurons were cultured in vitro for 1 and 5 d and immunofluorescence stained with an actin antibody. After 1 d in culture, both control (a) and Tm5NM1 (c) neurons extend neurites, whereas attenuation of neurite outgrowth is observed in the Tm3 neurons (e). After 5 d, a significant increase in axonal branching is the predominate phenotype observed in the Tm5NM1 neurons (d) compared with control (b) or Tm3 neurons (f). Bar, 20 μm (a, c, and e) and 40 μm (b, d, and f).
Figure 4.
Figure 4.
Tm3 impacts on dendrites and Tm5NM1 affects both dendrites and axonal branching. All measurements were performed on 5-d-old neurons. A dendrite or branch was defined as a process that was >10 μm in length. The axon was the longest process, confirmed by the presence of phosphorylated neurofilament H. An average of 50 neurons from each group was selected from a number of chamber slides from two independent cultures. A nonparametric ANOVA test was chosen because the data did not display a Gaussian distribution. Asterisks indicate *p < 0.001, **p < 0.005, and ***p < 0.01. Note that the Tm3 neurons showed a significant decrease in the number of dendrites (A) and total length of dendrites (B). In contrast, an increase in the number and length of dendrites is seen in the Tm5NM1 (A and B). The Tm5NM1 neurons also showed a significant increase in the total axon length (C) due to an increase in the number of axonal branches (D). The data were also plotted as a % of neurons with a particular range of dendrites (E), dendrite length (F), number of 1° axonal branches (G), and total axon length (H). This shows that the Tm5NM1 neurons have a wider range of morphologies.
Figure 5.
Figure 5.
Overexpression of Tm5NM1 results in enlarged growth cones. (A) Primary cortical neurons were cultured for 5 d and double immunofluorescence stained with the WS5/9d (red) antibody and β-actin (green). The merged images are depicted. Control neurons (a) and Tm5NM1 neurons (c, d, and e). Note the enlarged growth cones (arrows) and long filopodia in the Tm5NM1 neurons. Bar, 20 μm. (B) The surface areas of 1- and 5-d-old growth cones were determined by using Image-Pro Plus version 4.0 of neurons stained with a total actin antibody, C4. An average of 50 growth cones from each group was selected from a number of chamber slides from two independent cultures. A nonparametric ANOVA test was chosen because the data did not display a Gaussian distribution. Asterisks indicate *p < 0.001 and **p < 0.005. The data also were plotted as a percentage of neurons with a particular range of growth cone size for the 1- (C) and the 5 (D)-d-old neurons.
Figure 6.
Figure 6.
Attenuation of neurite outgrowth also is seen in Tm3 stably transfected B35 neuroepithelial cells. B35 cells were cultured in the absence (a, c, and f) and 48 h presence of dibutyryl cAMP (b, d, e, g, and h). Control B35 cells immunofluorescence stained with TM311 antibody (a) and β-actin (b), Tm3 B35 cells immunofluorescence stained with TM311 (c and e) and β-actin (d), and Tm5NM1 B35 cells immunofluorescence stained with LC1 (f and h) and β-actin (g). Elevated levels of Tm3 results in a significant decrease in the length of neurites after dibutyryl cAMP stimulation. Inset in g shows the lamellipodia like structure. Bar, 10 μm in f corresponds to a, c, e, f, and h. Bar, 10 μm in g corresponds to b, d, and g.
Figure 7.
Figure 7.
Recruitment of Tm5a by Tm5NM1 to the growth cone in vitro. Primary cortical neurons were cultured for 5 d and double immunofluorescence stained with WSα/9d that detects Tm5a (a, d, and g) and actin (b and e) or LC1 (h). (c) Merged image of a (red) and b (green). (f) Merged image of d (red) and e (green). (i) Merged image of g (red) and h (green). Note the enrichment of Tm5a in the peripheral region of the Tm5NM1 growth cone (d and g) where actin (e) and the exogenous Tm5NM1 (h) also are enriched. In control neurons, Tm5a (a) is highly diminished in 5-d-old growth cones although actin is present (b). Bar, 8 μm.
Figure 8.
Figure 8.
Recruitment of MHCIIB by Tm5NM1 to the growth cone. Primary cortical neurons cultured for 5 d were double immunofluorescence stained with MHCIIB (a, d, g, j, and m) and actin (b, e, and k) or LC1 (h) or TM311 to detect Tm3 (n). (c) Merged image of a (red) and b (green). (f) Merged image of d (red) and e (green). (i) Merged imaged of g (red) and h (green). (l) Merged image of j (red) and K (green). (o) Merged image of m (red) and n (green). Note the enrichment of MHCIIB in the peripheral region of the Tm5NM1 growth cones (d and g) where actin (e) and the exogenous Tm5NM1 (h) also are enriched. In contrast, such enrichment of MHCIIB was not observed in control (a) or Tm3 growth cones (j and m). Bar, 8 μm.
Figure 9.
Figure 9.
Quantitative analysis of MHCIIB localization to the growth cone periphery. Primary cortical neurons cultured for 5 d were double immunofluorescence stained with MHCIIB and actin. The intensity of fluorescence was measured in the leading edge (confirmed by the actin staining) and central region of the growth. The percentage of growth cones with a leading edge to central region intensity ratio of >1 was calculated from an average of 80 growth cones from two independent experiments. Asterisk indicates *p < 0.001.

References

    1. Bernstein, B. W., and Bamburg, J. R. (1982). Tropomyosin binding to F-actin protects the F-actin from disassembly by brain actin-depolymerizing factor (ADF). Cell Motil. 2, 1–8. - PubMed
    1. Boyd, J., Risinger, J. I., Wiseman, R. W., Merrick, B. A., Selkirk, J. K., and Barrett, J. C. (1995). Regulation of microfilament organization and anchorage-independent growth by tropomyosin 1. Proc. Natl. Acad. Sci. USA 92, 11534–11538. - PMC - PubMed
    1. Bridgman, P. C., Dave, S., Asnes, C. F., Tullio, A. N., and Adelstein, R. S. (2001). Myosin IIB is required for growth cone motility. J. Neurosci. 21, 6159–6169. - PMC - PubMed
    1. Bryce, N. S., et al. (2003). Specification of actin filament function and molecular composition by tropomyosin isoforms. Mol. Biol. Cell 14, 1002–1016. - PMC - PubMed
    1. Cooley, B. C., and Bergtrom, G. (2001). Multiple combinations of alternatively spliced exons in rat tropomyosin-α gene mRNA: evidence for 20 new isoforms in adult tissues and cultured cells. Arch. Biochem. Biophys. 390, 71–77. - PubMed

Publication types